
Bitcoin price struggled to clear the $20,000 resistance zone against the US Dollar. BTC might decline, but there is a key support waiting near the $18,900 zone.
- Bitcoin failed to gain momentum for a move above the $20,000 resistance zone.
- The price is trading below $19,400 and the 100 hourly simple moving average.
- There is a key bearish trend line forming with resistance near $19,250 on the hourly chart of the BTC/USD pair (data feed from Kraken).
- The pair could move down further to test the $18,900 support zone in the near term.
Bitcoin Price Trims Gains
Bitcoin price attempted a decent increase above the $19,500 resistance zone. BTC even climbed above the $19,800 level, but the bears were active near the $20,000 resistance zone.
The price traded as high as $19,939 before there was a fresh decline. There was a drop below the $19,500 and $19,400 levels. The bears even pushed the price below the 50% Fib retracement level of the upward move from the $18,271 swing low to $19,939 high.
Bitcoin price is now trading below $19,400 and the 100 hourly simple moving average. There is also a key bearish trend line forming with resistance near $19,250 on the hourly chart of the BTC/USD pair.
On the upside, an immediate resistance is near the $19,220 level. The first major resistance sits near the $19,250 level and the trend line. A clear move above the trend line resistance might pump the price towards the $19,500 resistance zone.
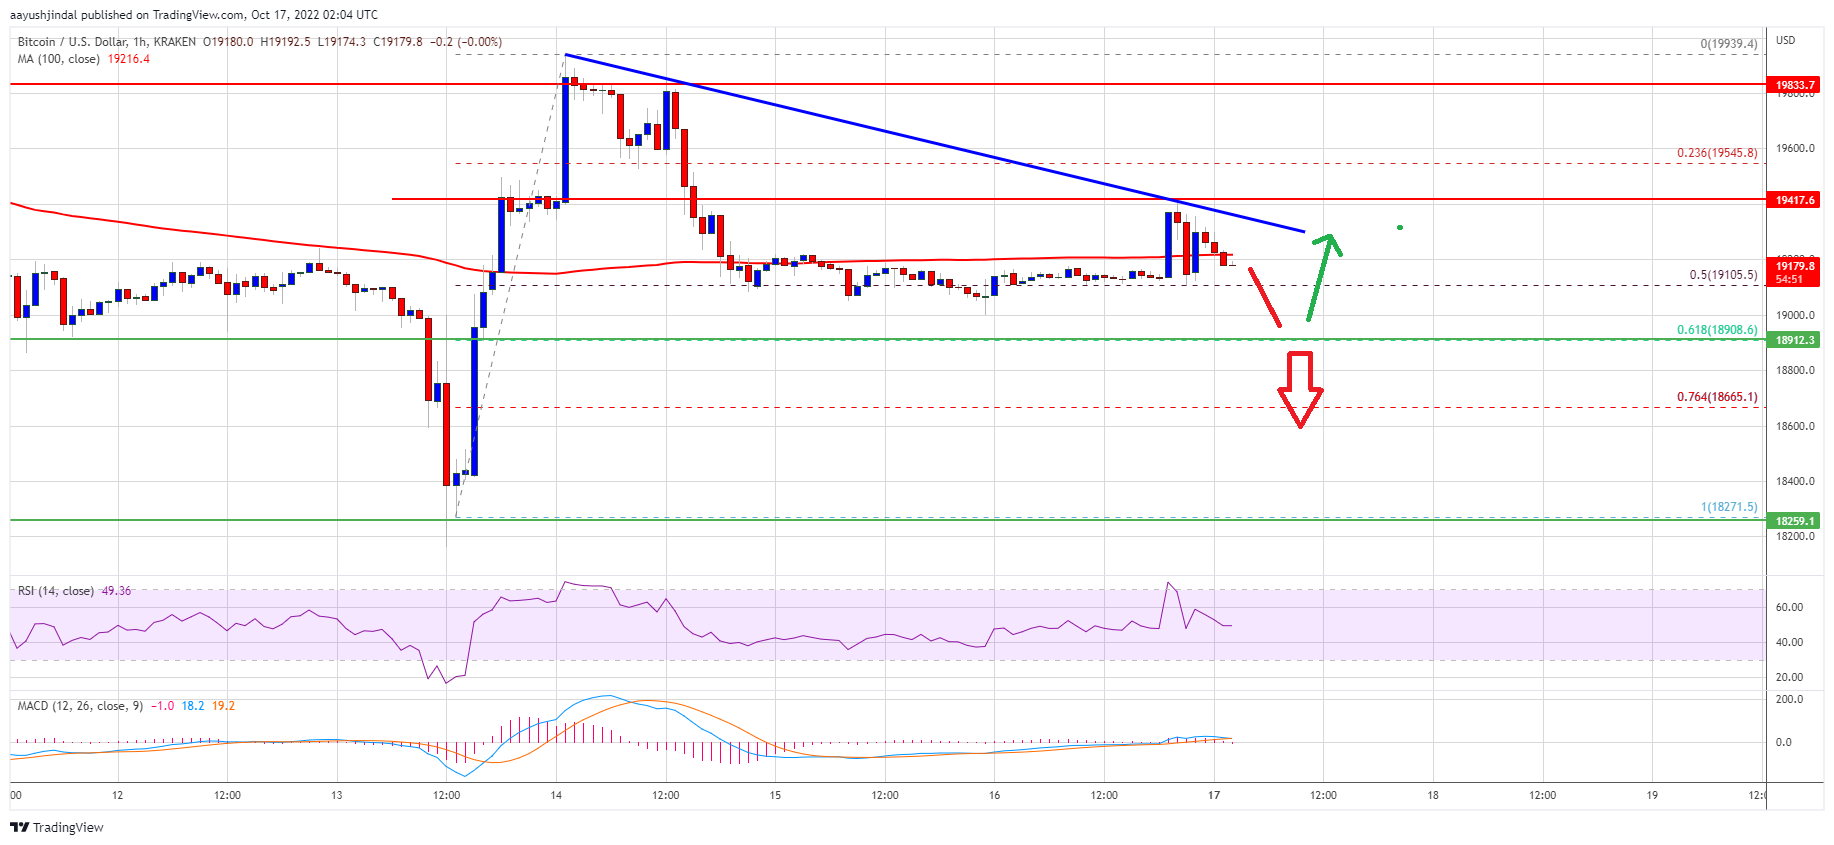
Source: BTCUSD on TradingView.com
The main resistance is still near the $20,000 zone. Any more gains might start a steady increase towards the $21,200 resistance zone.
Dips Limited in BTC?
If bitcoin fails to rise above the $19,250 resistance zone, it could continue to move down. An immediate support on the downside is near the $19,000 zone.
The next major support is near the $18,900 zone. It is near the 61.8% Fib retracement level of the upward move from the $18,271 swing low to $19,939 high. A downside break below the $18,900 support zone might increase selling pressure. In the stated case, the price could decline towards the $18,500 support zone.
Technical indicators:
Hourly MACD – The MACD is now gaining pace in the bearish zone.
Hourly RSI (Relative Strength Index) – The RSI for BTC/USD is now near the 50 level.
Major Support Levels – $19,000, followed by $18,900.
Major Resistance Levels – $19,250, $19,500 and $20,000.


