
Cosmos price could break out and initiate a short-term relief rally. Still, the long-term trend is still bearish and suggests that new yearly lows will eventually be reached.
ATOM price has been decreasing since reaching a high of $17.20 on Sep. 9. It created a lower high (red circle) on Sep. 18 and accelerated its rate of decrease afterward.
On Oct. 1, ATOM price broke down from an ascending support line that had been in place since the Jun. 18 lows of $5.55. This is a sign that the upward Cosmos price movement has come to an end.
The daily RSI supports the continuation of the downward movement. The indicator has broken down below the 50 level and twice validated it as resistance (red icons). This is a sign associated with bearish trends.
If the downward movement continues, the closest support area would be at $10.05. This is a horizontal support area for ATOM price and the 0.618 Fib retracement support level.
Cosmos Price Prediction: Short-Term Bounce and Breakout
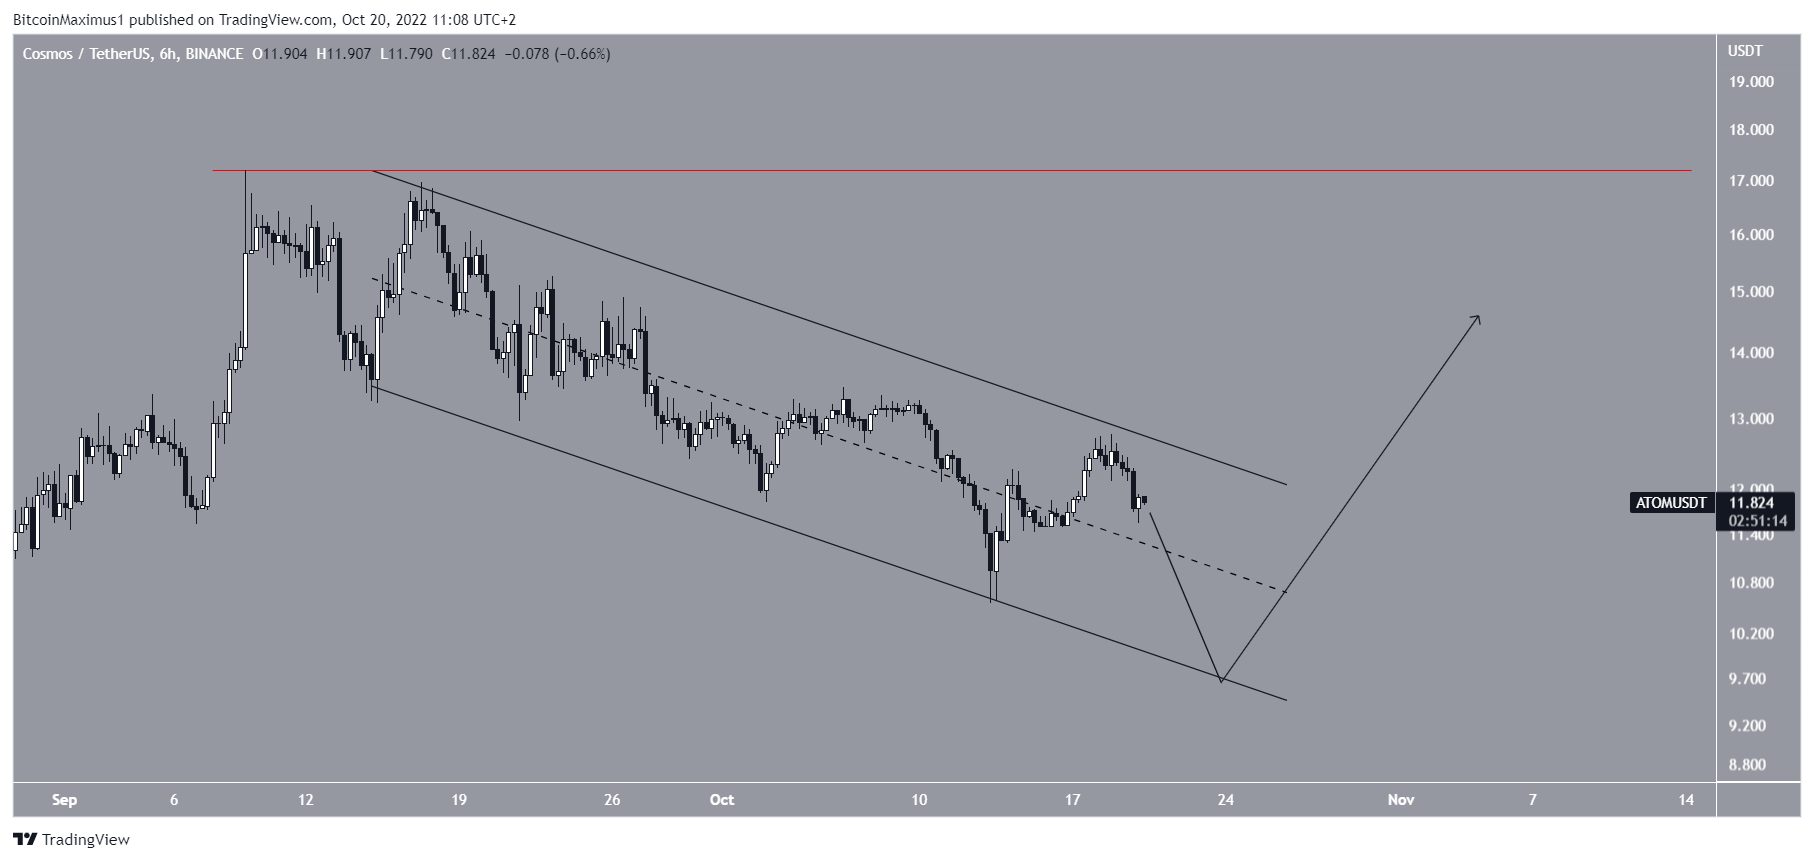
Despite the bearishness from the daily timeframe, the technical analysis for the six-hour timeframe shows a relatively bullish outlook. ATOM price has been decreasing inside a descending parallel channel since the aforementioned $17.20 high. Such channels usually contain corrective movements, meaning that an eventual breakout would be likely.
So, the most likely ATOM price prediction suggests that a drop towards the previously outlined $10.05 support area will occur, also validating the support line of the channel. Afterward, a short-term breakout will take the Cosmos price toward $15.
A movement above the $17.20 high (red line) would indicate that the trend is bullish and new highs will follow.
Will ATOM Price Fall to New Lows?
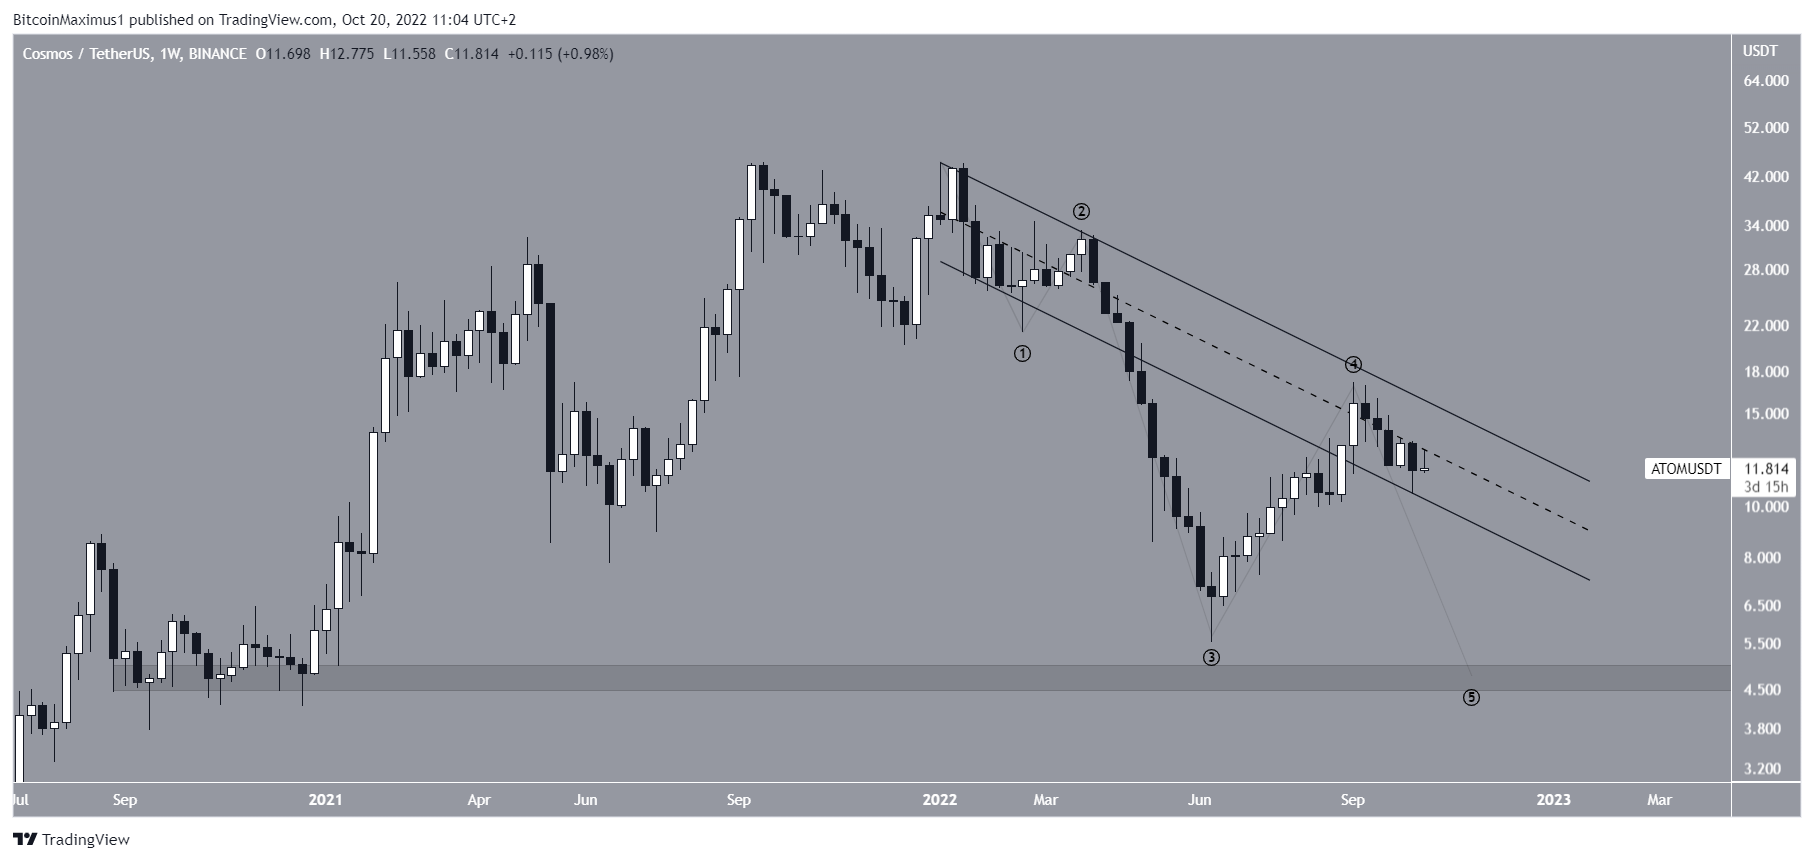
The weekly timeframe outlook is in alignment with the daily one. Since the 2022 high of $44.70, ATOM price has possibly begun a new five-wave downward movement (black). If so, it has just completed a fourth wave pullback, as evidenced by the rejection from the middle of the channel connecting the highs and lows of waves one and two, respectively.
If the count is correct, the Cosmos price has now begun the fifth and final wave of this decrease. The most likely level for it to end would be near the $4.80 horizontal support area, which has not been reached since Jan. 2021.
For the latest BeInCrypto Bitcoin (BTC) and crypto market analysis, click here
Disclaimer: BeInCrypto strives to provide accurate and up-to-date information, but it will not be responsible for any missing facts or inaccurate information. You comply and understand that you should use any of this information at your own risk. Cryptocurrencies are highly volatile financial assets, so research and make your own financial decisions.
Disclaimer
All the information contained on our website is published in good faith and for general information purposes only. Any action the reader takes upon the information found on our website is strictly at their own risk.


