
Ethereum is trading just above the important $2,000 psychological level, but the apparent stabilization may be deceptive. According to a technical analysis published on TradingView by crypto analyst RLinda, what looks like a recovery attempt is, in fact, a counter-trend correction, a bear market bounce that could be setting bulls up for a painful flush lower.
Crypto Winter Tightens Its Grip
RLinda’s analysis opens with a direct assessment of how the crypto winter is still in play and support might break down around $2,000.
Technical analysis of the 2-hour timeframe chart shows that Ethereum has already printed a series of lower highs and lower lows following its rejection around $2,380 in mid-March. The most recent lower low saw the Ethereum price drop to the $1,960-$1,990 zone over the weekend, which confirms that sellers are still battling for control, forcing the market into what RLinda describes as a counter-trend correction.
Related Reading
This type of correction often creates the illusion of recovery. Price begins to grind upward or move sideways, but within the context of a broader bearish structure. The charts reflect this clearly, with Ethereum now attempting a modest rebound after establishing a local bottom just below $2,000 over the weekend.
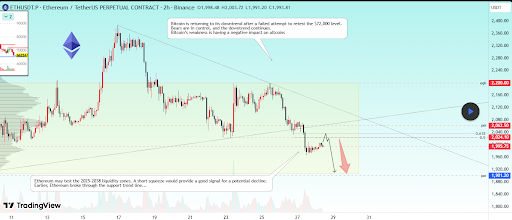
Making matters worse is the macro backdrop relating to Bitcoin. Bitcoin, which had been staging what appeared to be a recovery attempt to $72,000 last week, has failed to hold those gains and reversed to as low as $65,810 over the weekend. Bears have reasserted control and Bitcoin’s weakness is cascading directly into altcoins. This, in turn, might cause the Ethereum price to bear the brunt of that spillover pressure in the coming days.
Price Battlegrounds To Watch Out For
The immediate focus on the 2-hour chart is a tight resistance cluster formed between $2,024 and $2,062. This zone coincides with multiple technical factors visible on the chart, including prior support turned resistance, Fibonacci retracement levels around 0.5 and 0.618, and a descending trendline pressing down on lower highs in March.
Related Reading
According to RLinda, Ethereum may test the 2025 to 2038 liquidity zones. A short squeeze would provide a good signal for a potential decline. Price resistance levels to watch in this case are at $2,025, $2,037, and $2,062. The point of interest (POI) at $2,062.50, which is also shown on the chart above, is the most important one.
A retest of this resistance zone, followed by a false breakout and consolidation in the short zone, will confirm bear dominance. Should that confirmation materialize, it could create a counter-trend correction that leads to a new round of selling pressure that pushes the Ethereum price to a support point of interest around $1,900. At the time of writing, Ethereum is trading at $2,050.

Featured image from Pixabay, chart from Tradingview.com

