
Bitcoin is holding the key $18,500 support zone against the US Dollar. BTC must settle above the $20,000 resistance zone to move into a positive zone.
- Bitcoin is struggling to gain momentum above the $19,500 resistance zone.
- The price is trading below $19,000 and the 100 hourly simple moving average.
- There is a key bearish trend line forming with resistance near $19,020 on the hourly chart of the BTC/USD pair (data feed from Kraken).
- The pair could stage a fresh rally if there is a clear move above the $19,500 resistance zone.
Bitcoin Price Consolidates
Bitcoin price made another attempt to clear the $19,500 resistance zone. However, BTC struggled and formed a short-term top near the $19,400 level.
A high was formed near $19,392 and the price declined. There was a move below the $19,000 level and the 100 hourly simple moving average. The pair traded as low as $18,645 and is currently consolidating losses. There was a minor increase above the $18,800 level.
Bitcoin price climbed above the 23.6% Fib retracement level of the recent decline from the $19,392 swing high to $18,645 low. On the upside, an immediate resistance is near the $19,000 level and the 100 hourly simple moving average.
There is also a key bearish trend line forming with resistance near $19,020 on the hourly chart of the BTC/USD pair. The trend line is near the 50% Fib retracement level of the recent decline from the $19,392 swing high to $18,645 low.
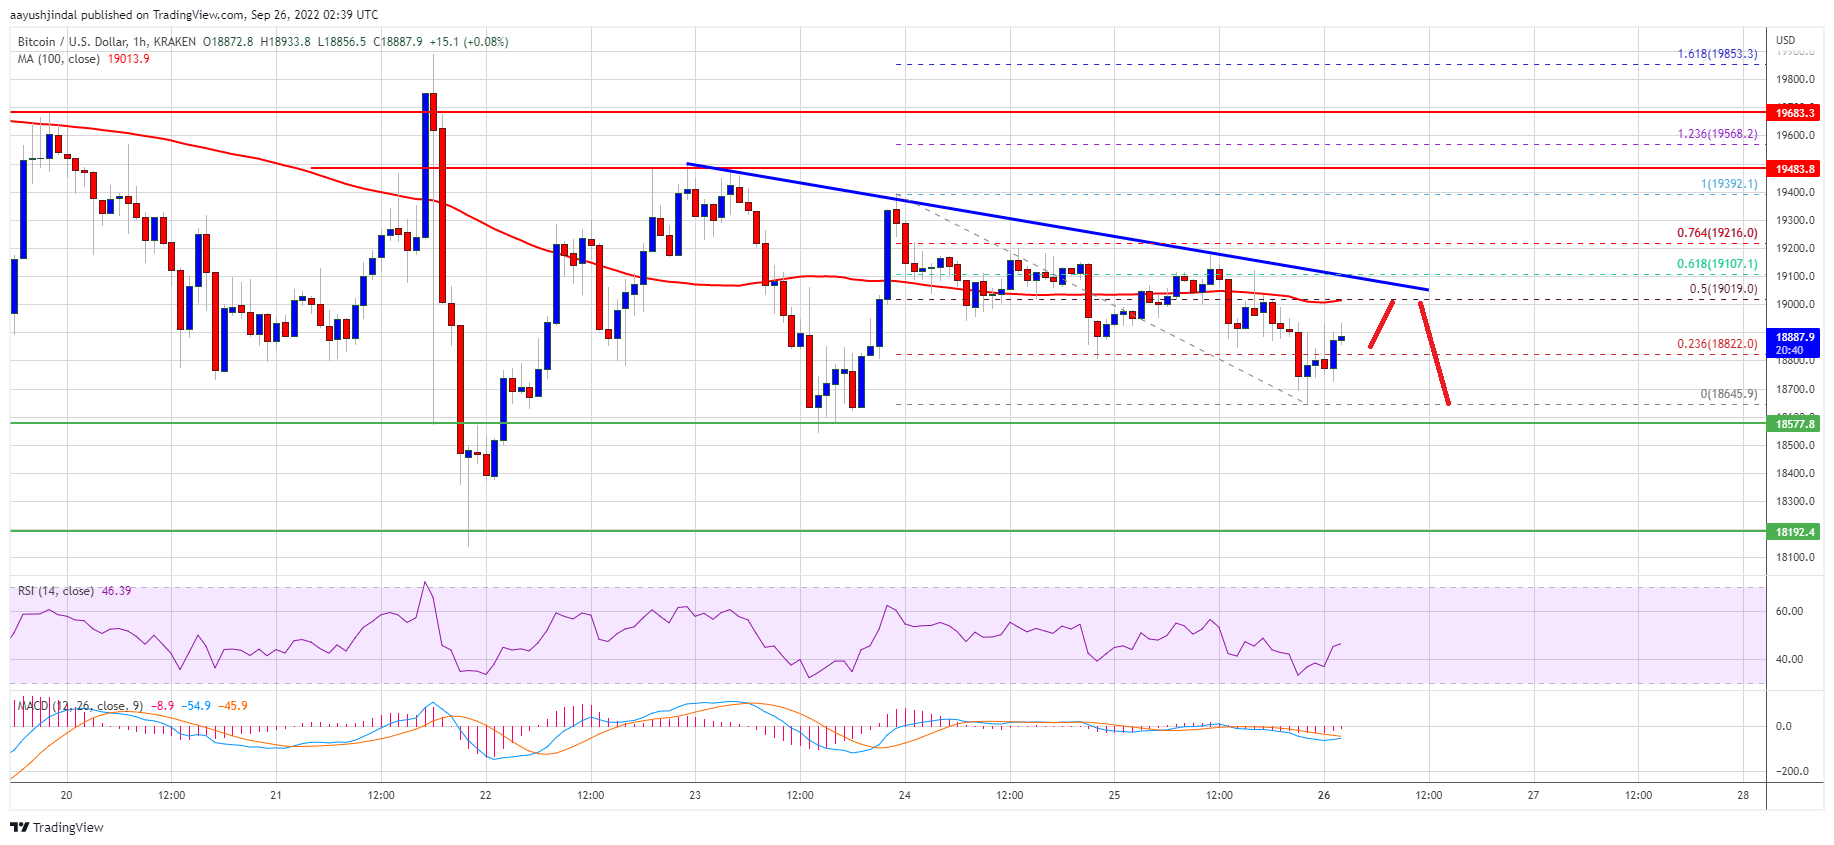
Source: BTCUSD on TradingView.com
The next major resistance sits near the $19,500 zone. A close above the $19,500 level might start a fresh surge to $20,000. Any more gains might start a steady increase and the price might rise towards the $21,500 resistance zone.
Fresh Decline in BTC?
If bitcoin fails to recover above the $19,500 zone, it could start a fresh decline. An immediate support on the downside is near the $18,650 zone.
The next major support is near the $18,500 level. A clear move below the $18,500 zone could set the pace for a fresh decline. In the stated case, the price may even test the $17,500 level.
Technical indicators:
Hourly MACD – The MACD is now losing pace in the bullish zone.
Hourly RSI (Relative Strength Index) – The RSI for BTC/USD is now just below the 50 level.
Major Support Levels – $18,650, followed by $18,500.
Major Resistance Levels – $19,000, $19,350 and $19,500.

