
Bitcoin price started a recovery wave above $90,000. BTC is now consolidating and might soon aim for a move above the $91,500 zone.
- Bitcoin started a recovery wave and climbed toward $92,000.
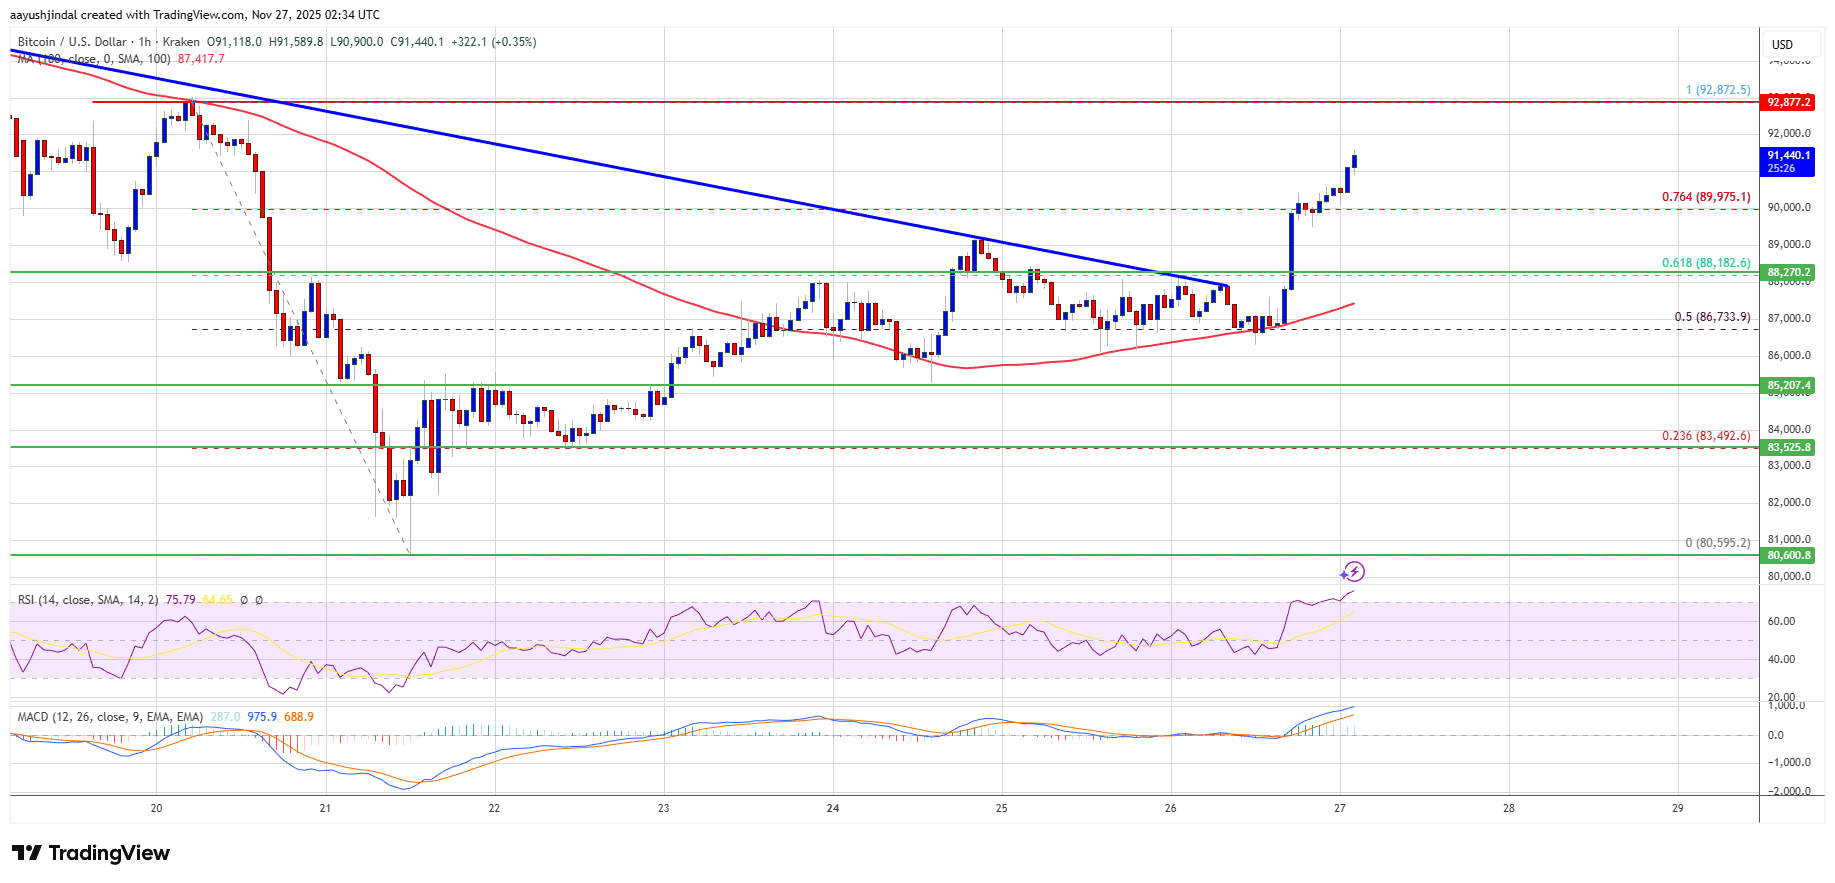
- The price is trading above $90,000 and the 100 hourly Simple moving average.
- There was a break above a key bearish trend line with resistance at $88,000 on the hourly chart of the BTC/USD pair (data feed from Kraken).
- The pair might continue to move up if it settles above the $91,500 zone.
Bitcoin Price Eyes Steady Gains
Bitcoin price managed to stay above the $86,500 level. BTC formed a base and recently started a recovery wave above the $88,000 resistance zone.
There was a break above a key bearish trend line with resistance at $88,000 on the hourly chart of the BTC/USD pair. The pair surged above the $90,000 level. There was a clear break above the 61.8% Fib retracement level of the downward move from the $92,872 swing high to the $80,595 low.
Bitcoin is now trading above $90,500 and the 100 hourly Simple moving average. It is also above the 76.4% Fib retracement level of the downward move from the $92,872 swing high to the $80,595 low.
If the bulls remain in action, the price could face resistance near the $91,500 level. The first key resistance is near the $92,000 level. The next resistance could be $92,500. A close above the $92,500 resistance might send the price further higher. In the stated case, the price could rise and test the $93,750 resistance. Any more gains might send the price toward the $94,500 level. The next barrier for the bulls could be $95,000 and $95,500.
Another Decline In BTC?
If Bitcoin fails to rise above the $92,000 resistance zone, it could start another decline. Immediate support is near the $89,750 level. The first major support is near the $88,500 level.
The next support is now near the $88,000 zone. Any more losses might send the price toward the $86,500 support in the near term. The main support sits at $85,000, below which BTC might accelerate lower in the near term.
Technical indicators:
Hourly MACD – The MACD is now gaining pace in the bullish zone.
Hourly RSI (Relative Strength Index) – The RSI for BTC/USD is now above the 50 level.
Major Support Levels – $89,750, followed by $88,000.
Major Resistance Levels – $92,000 and $92,500.

