

- XRM price breaks down into a ranging channel as price failed to break above resistance, holding price from trending higher.
- XRM trades below 50 and 200-day Exponential Moving Average as the price struggles to regain bullish signs as the price continues ranging in a descending triangle.
- The price of XRM needs to break out of the descending triangle with good volume to rally high to a region of $200.
Monero (XRM) prices continue to struggle as they range in a channel in an attempt to rekindle their bullish movement against tether (USDT). Monero (XRM) and other crypto assets experienced a relief bounce in recent weeks, which saw the crypto market cap look good for cryptocurrencies across the industry, with many producing double-digit gains. Monero (XRM) showed some relief bounces but was quickly rejected into a range price movement. (Data from Binance)
Monero (XRM) Price Analysis On The Weekly Chart
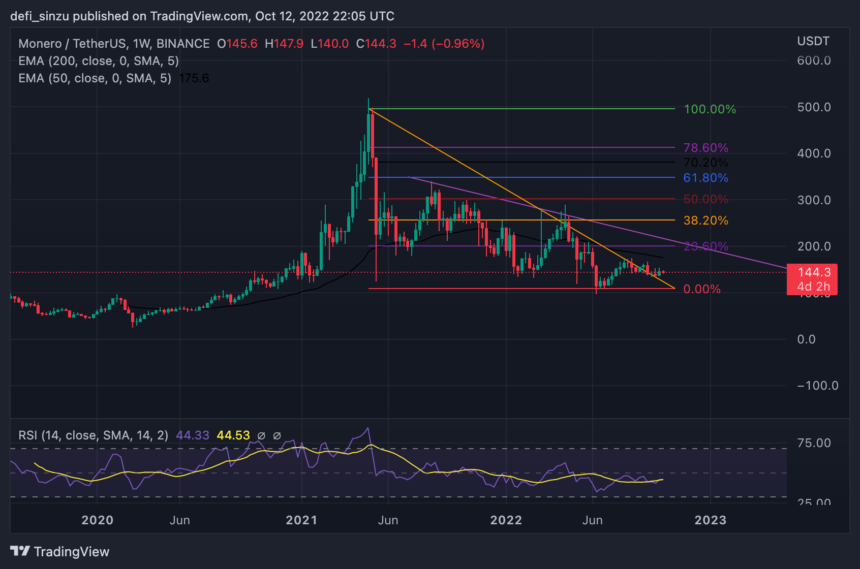
Despite having a tough time in recent months with the price falling to a low of $100 with over 70% drop from an all-time high of $517. This incredible price movement was cut short due to the market condition. The crypto market has remained in a bear market for over six months, leading to many crypto assets retesting their weekly low while others hang on to key support.
After the price of XRM rallied to a high of $260, the price declined as it dropped to a weekly low of $100, where the price held strong after forming support, and this region looked like a demand zone for prices.
The price of XRM bounced off from this region of $100 as the price rallied to a weekly high of $150 as the price faced resistance to breaking higher as the price continued to range in a channel. The resistance value corresponds to the Fibonacci ratios (Fibs) at 38.2%, acting as resistance for the price to go higher. For XRM to trend, a higher price must overcome the resistance at $150.
Weekly resistance for the price of XRM – $150.
Weekly support for the price of XRM – $100.
Price Analysis Of XRM On The Daily (1D) Chart
On a daily timeframe, the price of XRM remains below the 50 and 200-day Exponential Moving Averages (EMA), which is not conducive to an upward price trend in the short term. Prices of $150 and $162 correspond to the 50 and 200 EMAs, which act as resistance for XRM.
For the price of XRM to resume its bullish trend, it must break above $162 with good volume closing above it.
Daily resistance for the XRM price – $162.
Daily support for the XRM price – $100.
Featured Image From zipmex, Charts From Tradingview