
Bitcoin (BTC) has slipped 2% today, as the broader crypto market continues to face downward pressure. The decline comes amid weakening trading volumes, indicating cautious sentiment among investors.
However, on-chain data suggests that this pullback may be temporary.
BTC Bulls Hold the Line
One of the more notable signals comes from a concentrated liquidity cluster forming around the $103,000 zone. Readings from BTC’s liquidation heatmap show a concentration of liquidity below its price at the $103,221 zone.
This suggests significant market support waiting to be activated if the price dumps toward this level. Liquidation heatmaps are used to identify price levels where large clusters of leveraged positions are likely to be liquidated. These maps highlight areas of high liquidity, often color-coded to show intensity.
BTC’s liquidation heatmap suggests that strong support is waiting to absorb selling pressure if the coin witnesses a correction toward the cluster zone. Traders have placed many buy orders at the $103,221 area, indicating confidence that BTC is unlikely to break below this threshold.
Furthermore, BTC’s positive funding rate, at 0.0025% at press time, adds to the cautiously optimistic outlook. It reflects traders’ willingness to pay a premium for long positions.

The funding rate is a recurring payment exchanged between long and short traders in perpetual futures markets to keep prices aligned with the spot market. When its value is positive, it indicates bullish market sentiment, as more traders are expecting the asset’s price to rise.
$106,000 or Bust? Bitcoin’s Next Move Hinges on Global Tensions
Despite the bullish on-chain signals, BTC remains heavily influenced by broader market sentiment, which has been weakening amid escalating tensions between Israel and Iran.
Bitcoin’s price rally could stall if the geopolitical situation deteriorates further, potentially sliding toward $103,061. Should the liquidity cluster near $103,000 fail to provide support, a deeper drop to $101,610 could follow.
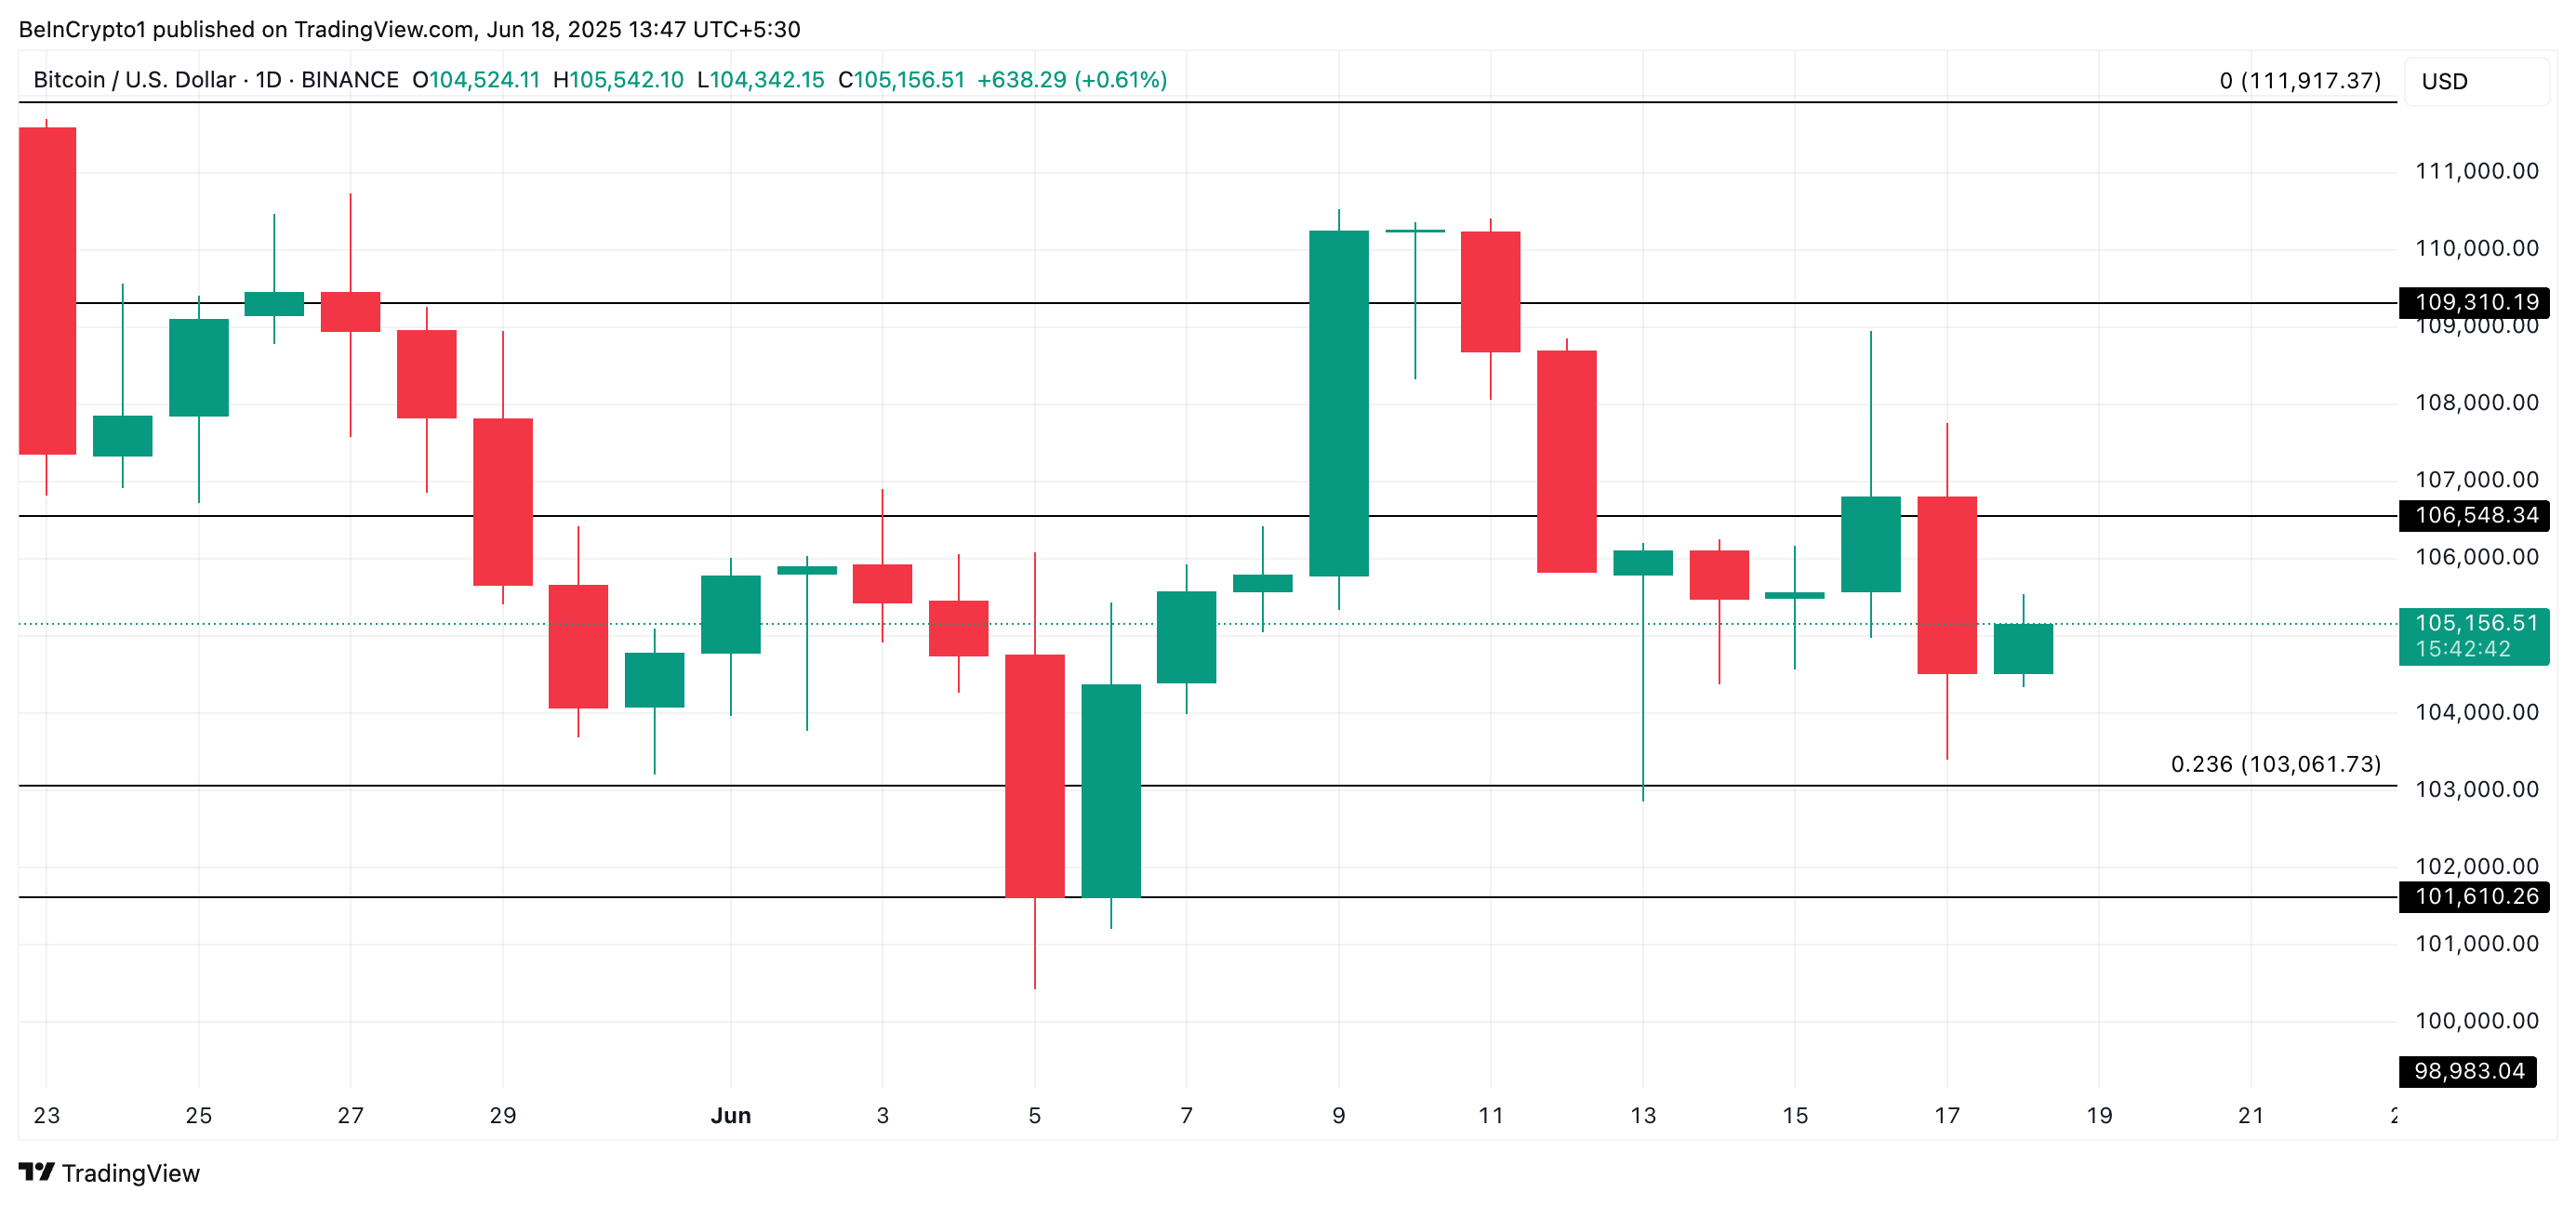
Conversely, if bullish momentum returns and market sentiment improves, the coin could rebound from recent lows and move toward the $106,548 level.
Disclaimer
In line with the Trust Project guidelines, this price analysis article is for informational purposes only and should not be considered financial or investment advice. BeInCrypto is committed to accurate, unbiased reporting, but market conditions are subject to change without notice. Always conduct your own research and consult with a professional before making any financial decisions. Please note that our Terms and Conditions, Privacy Policy, and Disclaimers have been updated.

