
After rebounding from an 11-month low following last Friday’s crash, XRP has been trading sideways, showing little price movement.
However, on-chain indicators suggest that a bullish breakout may be on the horizon, as market participants appear to be interpreting the token’s lackluster performance over the past few days as a buying opportunity.
Sponsored
Sponsored
XRP Traders Quietly Buying
Readings from the XRP/USD daily chart show that the altcoin has oscillated within a narrow range over the past four trading sessions. Since October 11, Ripple’s XRP has faced resistance at $2.6208, while finding support at $2.3820.
For token TA and market updates: Want more token insights like this? Sign up for Editor Harsh Notariya’s Daily Crypto Newsletter here.
While its price remains flat, the Chaikin Money Flow (CMF) is trending upward, signaling underlying demand. As of this writing, the momentum indicator rests above the zero line at 0.10, pointing to an XRP accumulation trend among market participants.
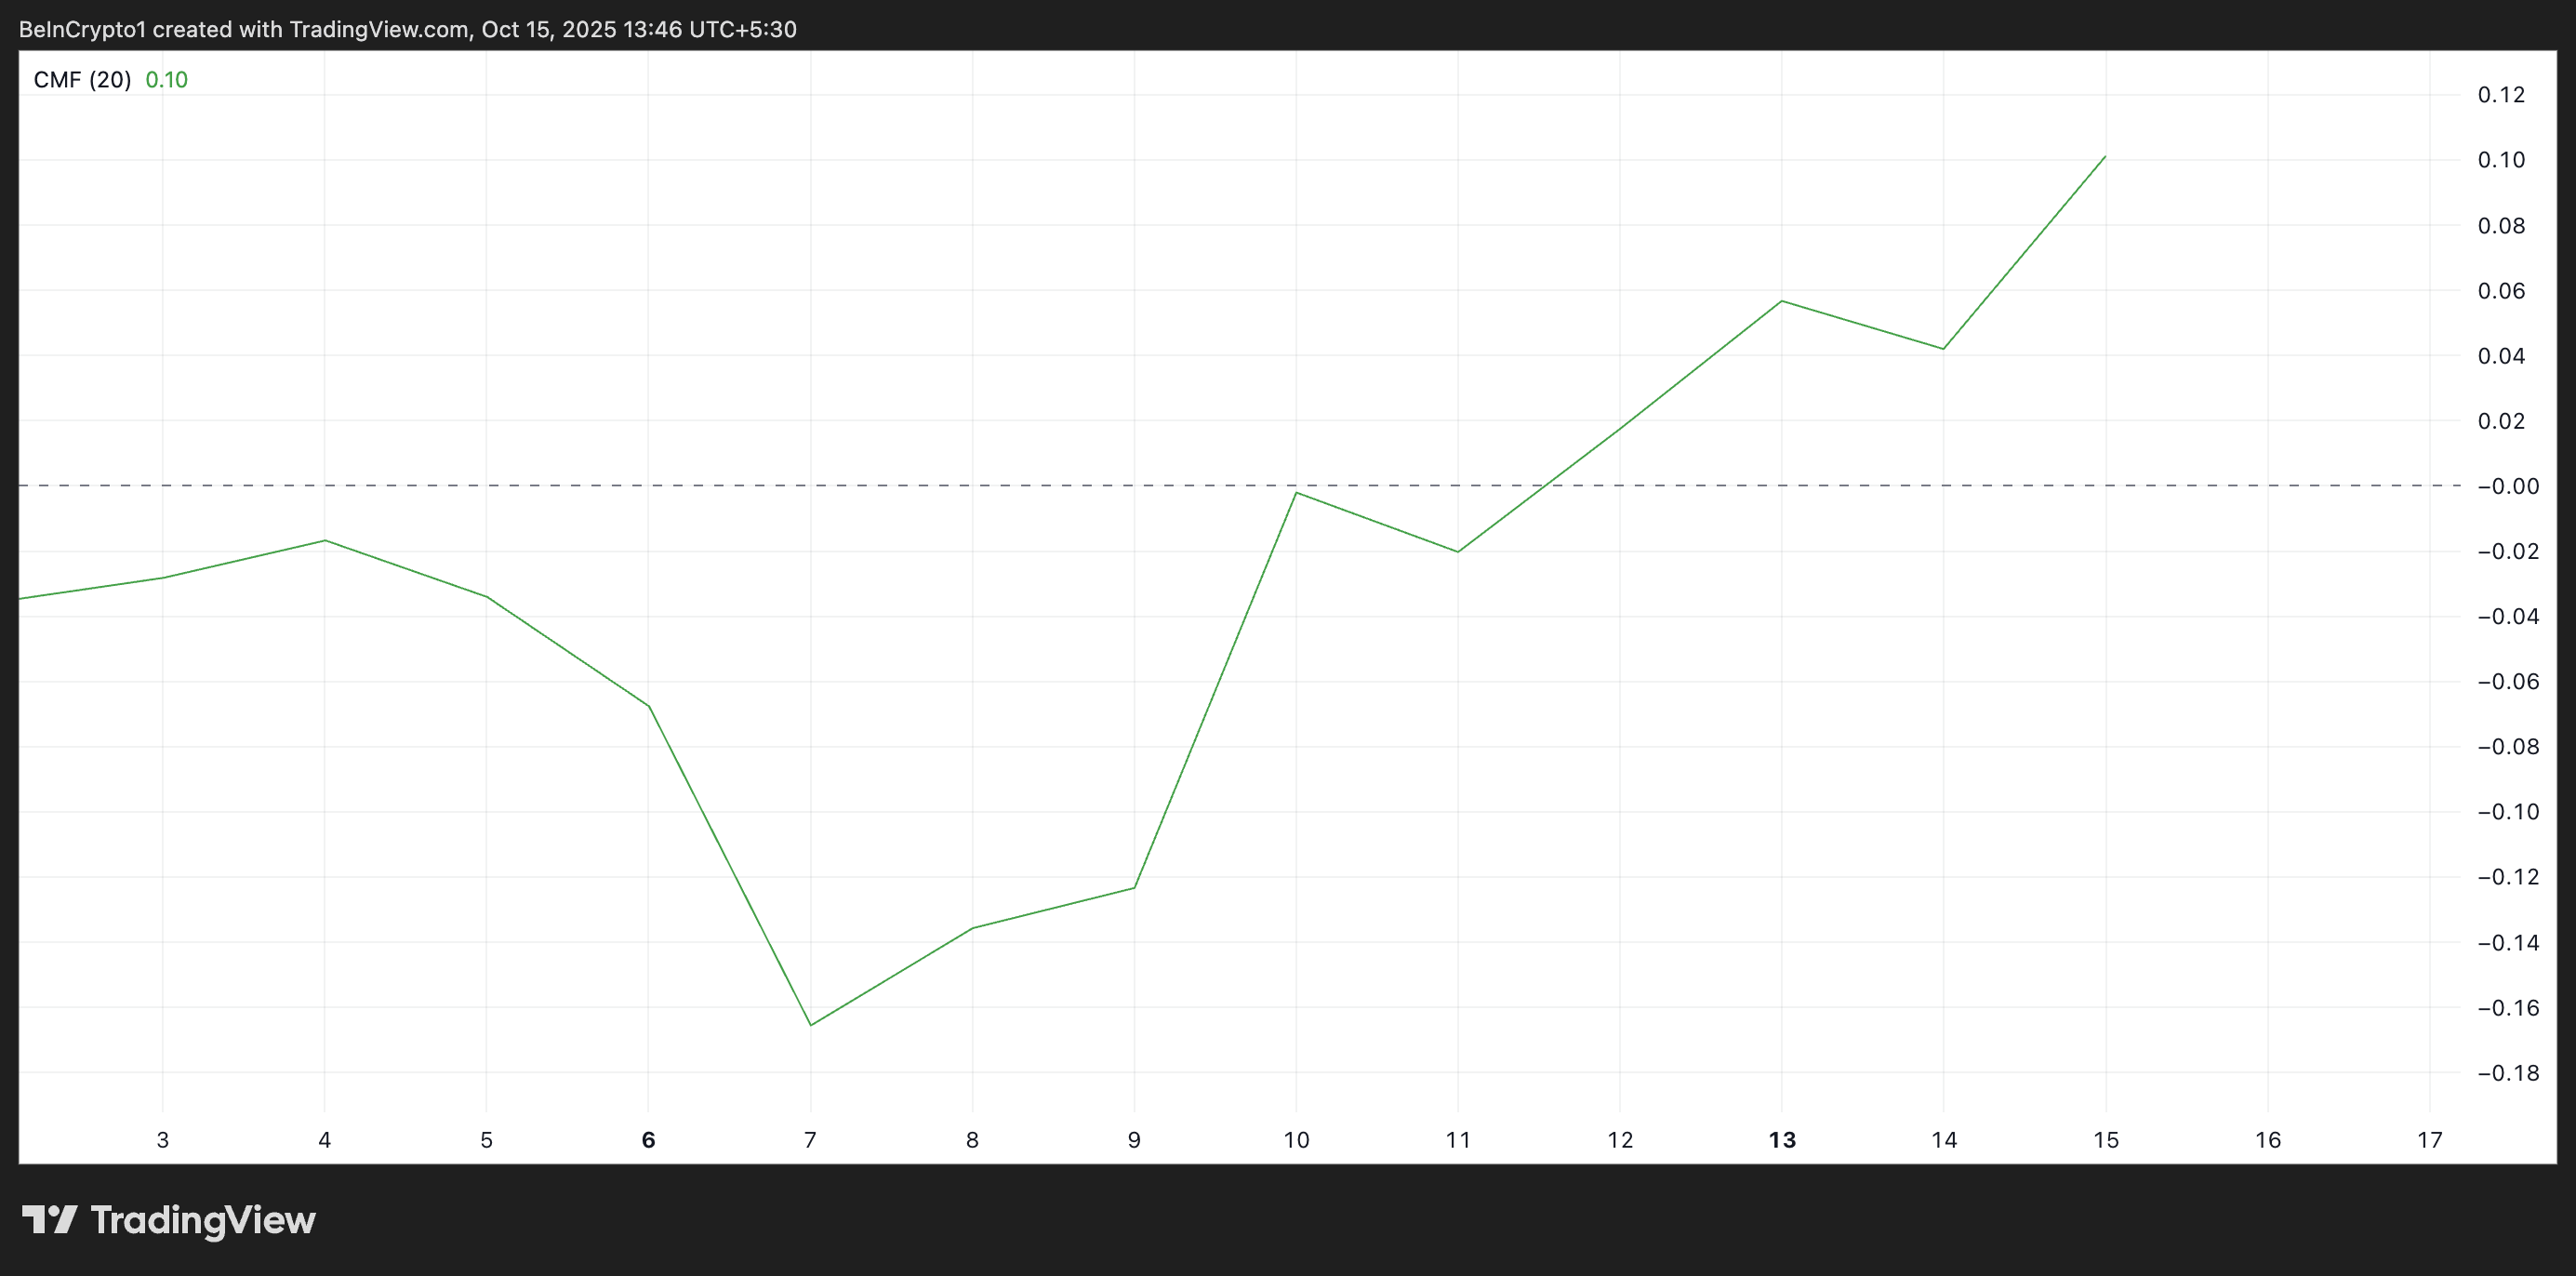
The CMF indicator measures how money flows into and out of an asset. When it rises above the zero line, it indicates that buying pressure outweighs selling pressure. Conversely, readings below zero reflect stronger selling pressure, implying distribution.
What makes XRP’s current situation noteworthy is that the CMF is rising while its price remains flat. This divergence means that, despite the market not seeing significant price movement, buyers are quietly accumulating XRP, which may trigger an upward breakout.
Sponsored
Sponsored
Liquidity Concentration Could Pull XRP Higher in the Near Term
Additionally, XRP’s liquidation heatmap shows a concentration of liquidity above its current price. Per Coinglass data, this sits around $2.9196 as of this writing.
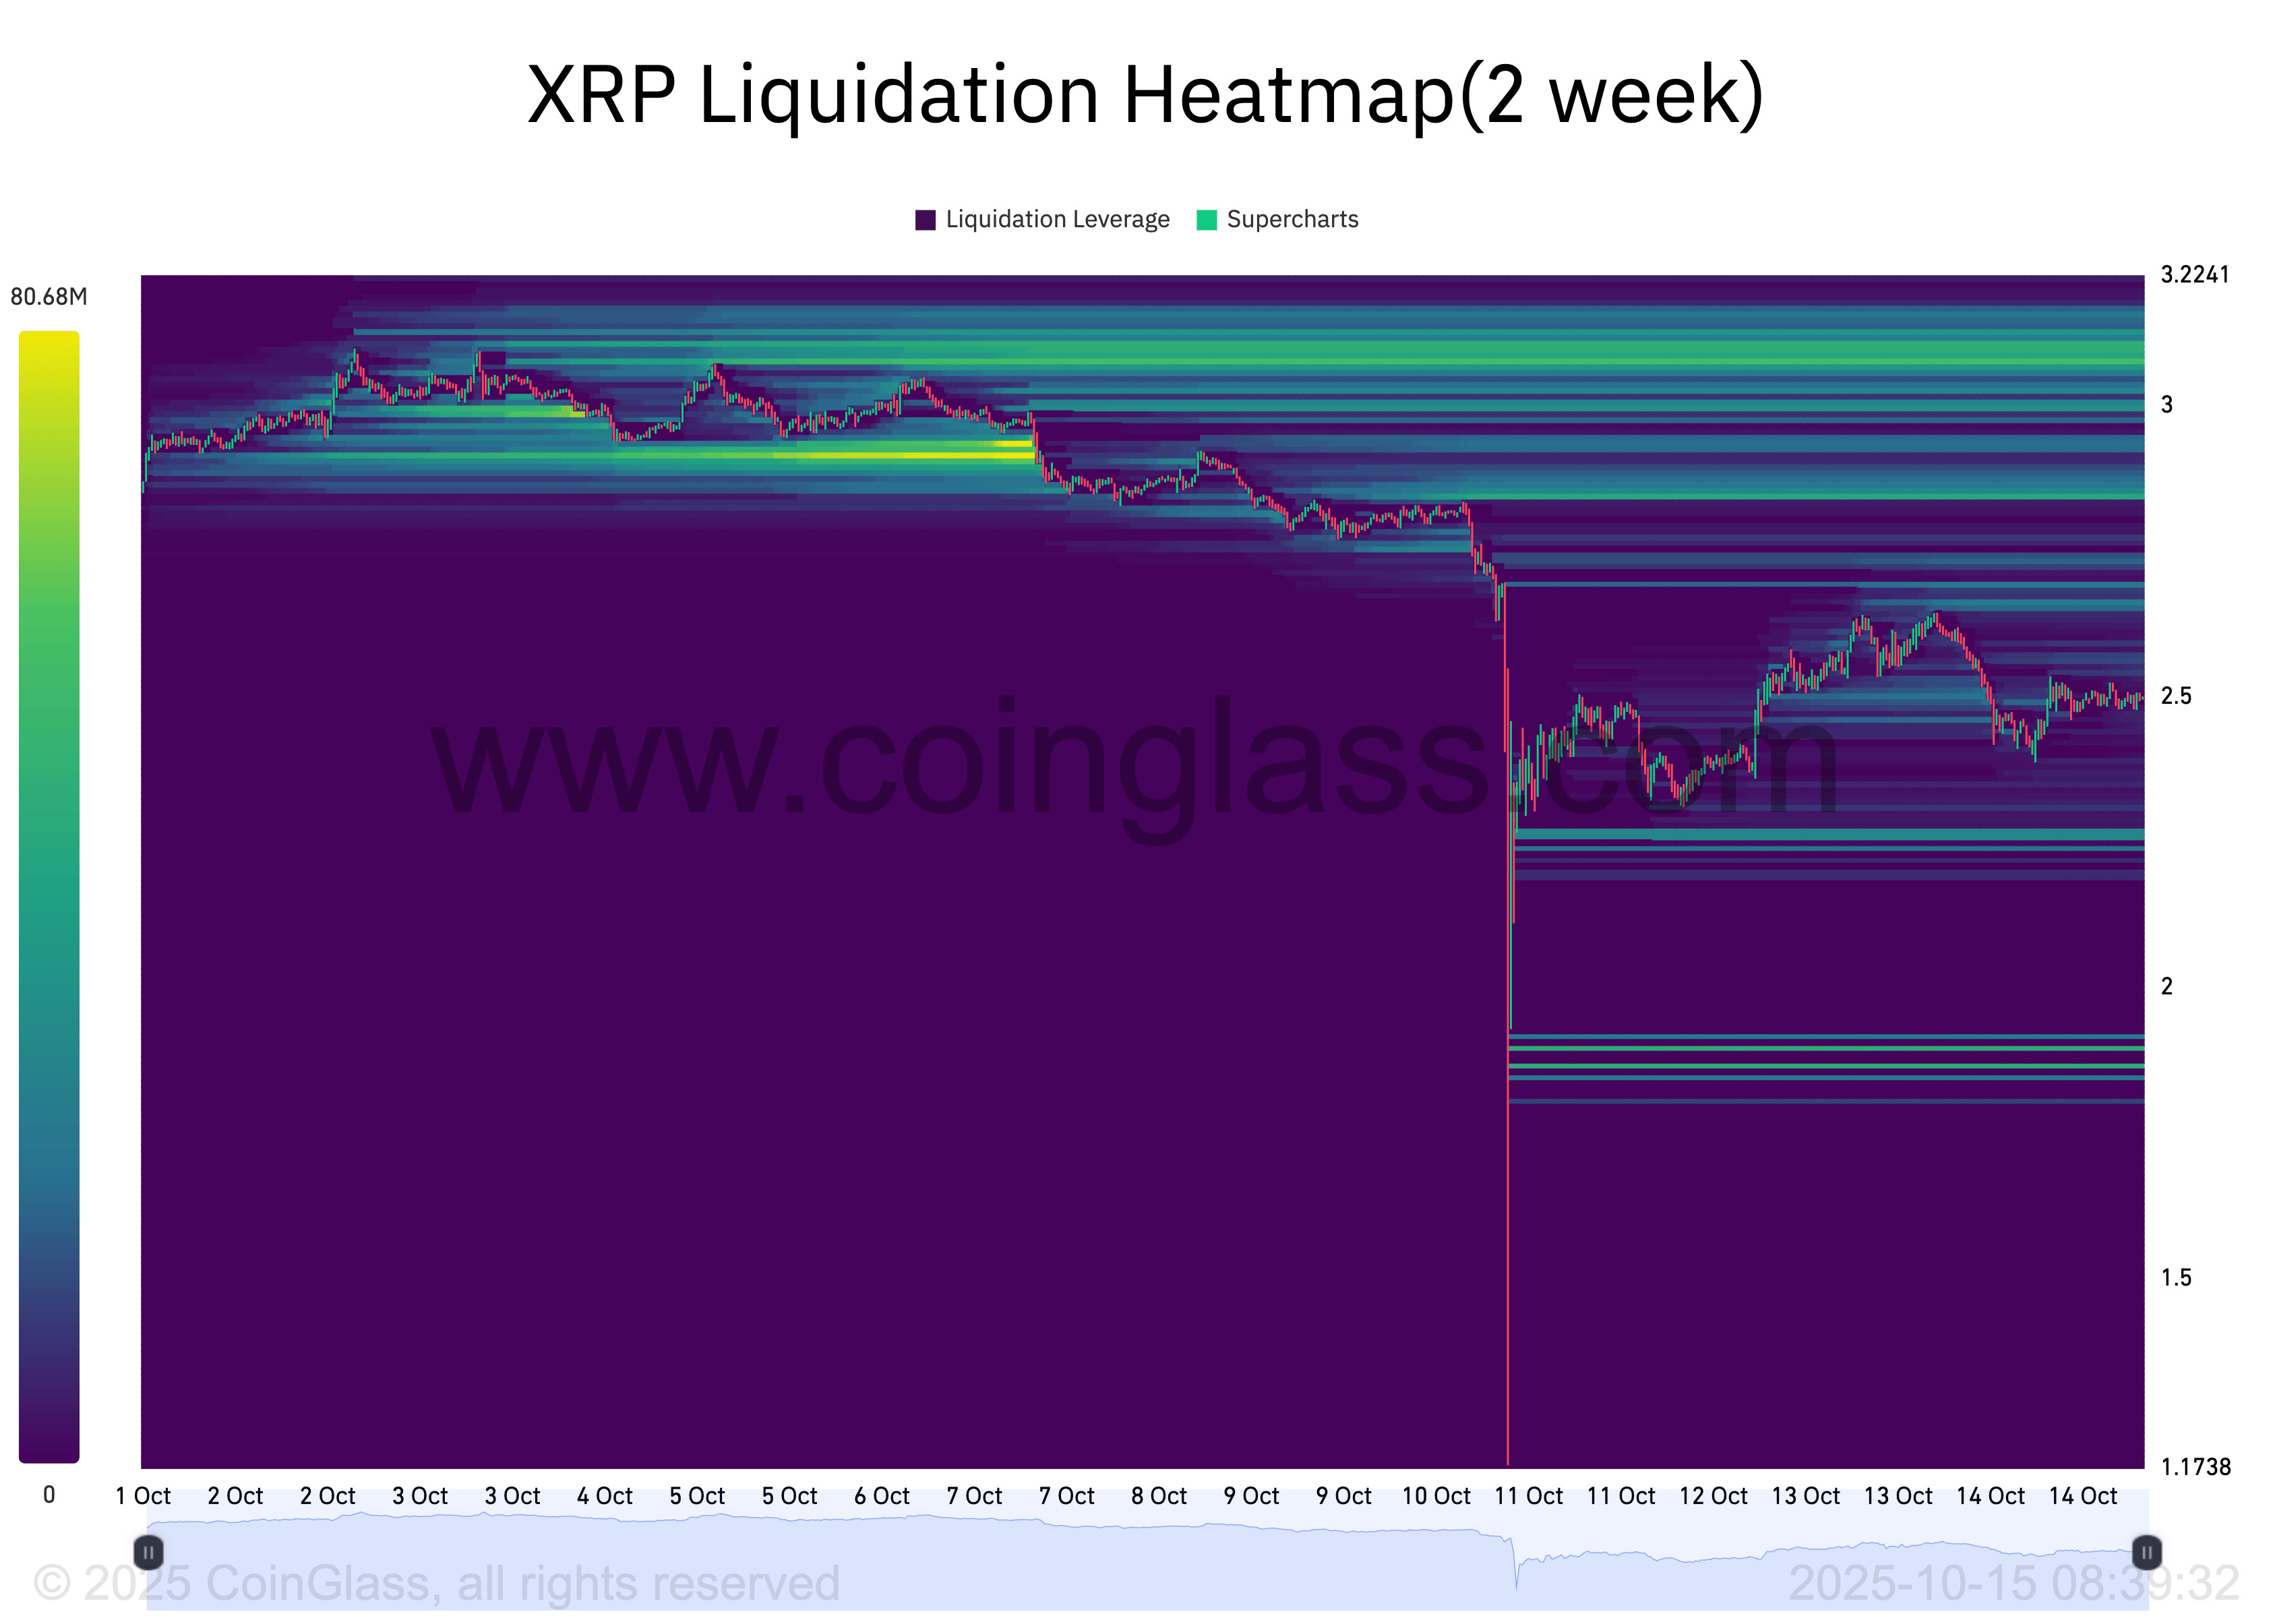
Liquidation heatmaps help traders identify price zones where many leveraged positions could be wiped out. They highlight areas of high liquidity, often color-coded, with brighter areas indicating heavier liquidation risk.
Usually, these liquidity clusters often act as magnets for upward price movement, as traders look to trigger stop-losses or margin liquidations, which could drive a bullish move.
For XRP, the concentration of liquidity around $2.9196 indicates strong trader interest in buying or closing short positions at that price. This points to the possibility of a near-term price rally.
XRP Eyes $2.74 as Bulls Test Resistance at $2.62
As of this writing, XRP trades at $2.5108. If demand for the altcoin strengthens and it pushes above the resistance at $2.6208, it could drive its price toward $2.7415.
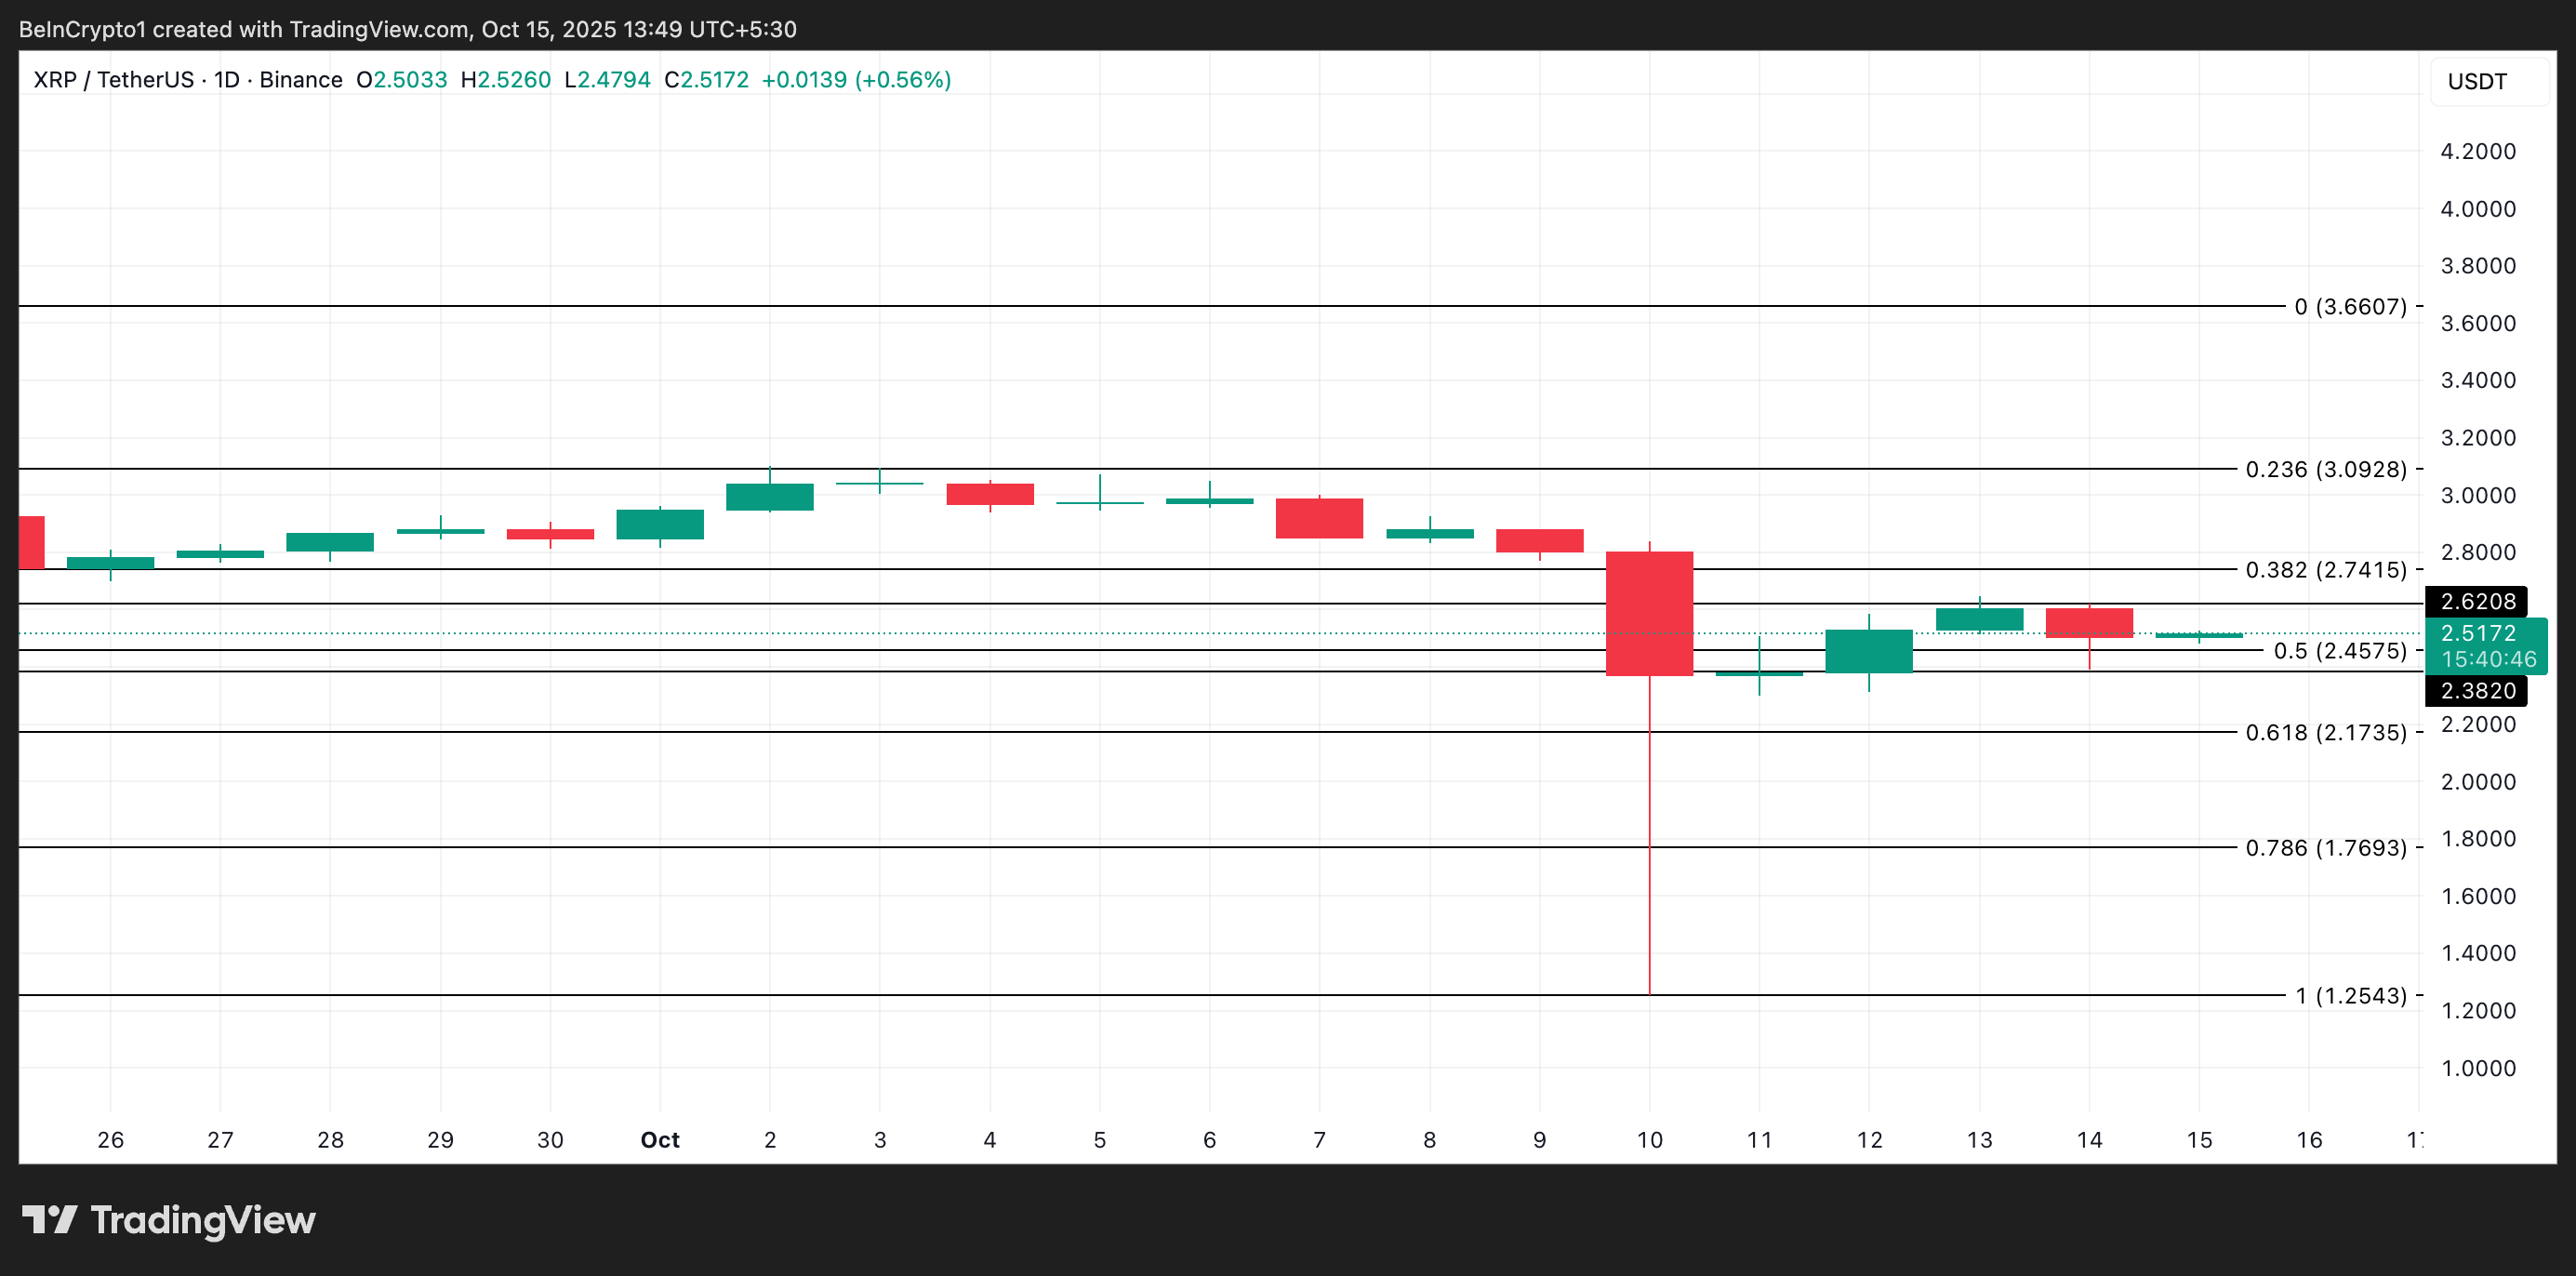
However, an uptick in bearish sentiment could trigger a break below the support at $2.3820. In this scenario, XRP may extend its decline to $2.1735.

