
Solana’s price is caught between stubborn buyers and active sellers, with neither side backing off. The coin is up 4.5% in the past 24 hours but still down 7% over the month, showing how every bounce gets met with selling pressure.
Now, on-chain and chart signals suggest this standoff may be nearing a turning point.
Sponsored
Long-Term Sellers Slow Down, Short-Term Traders Shift Gears
The Hodler Net Position Change, which tracks whether long-term investors are adding or selling, remains negative — meaning Solana holders are still cashing out. But the pace of selling has eased sharply.
On October 3, long-term holders sold around 11.43 million SOL, compared to 4.55 million SOL on October 23. That’s a major 60% drop in selling pressure. They’re not buying yet, but they’re clearly slowing down, a pattern that often appears near local bottoms.
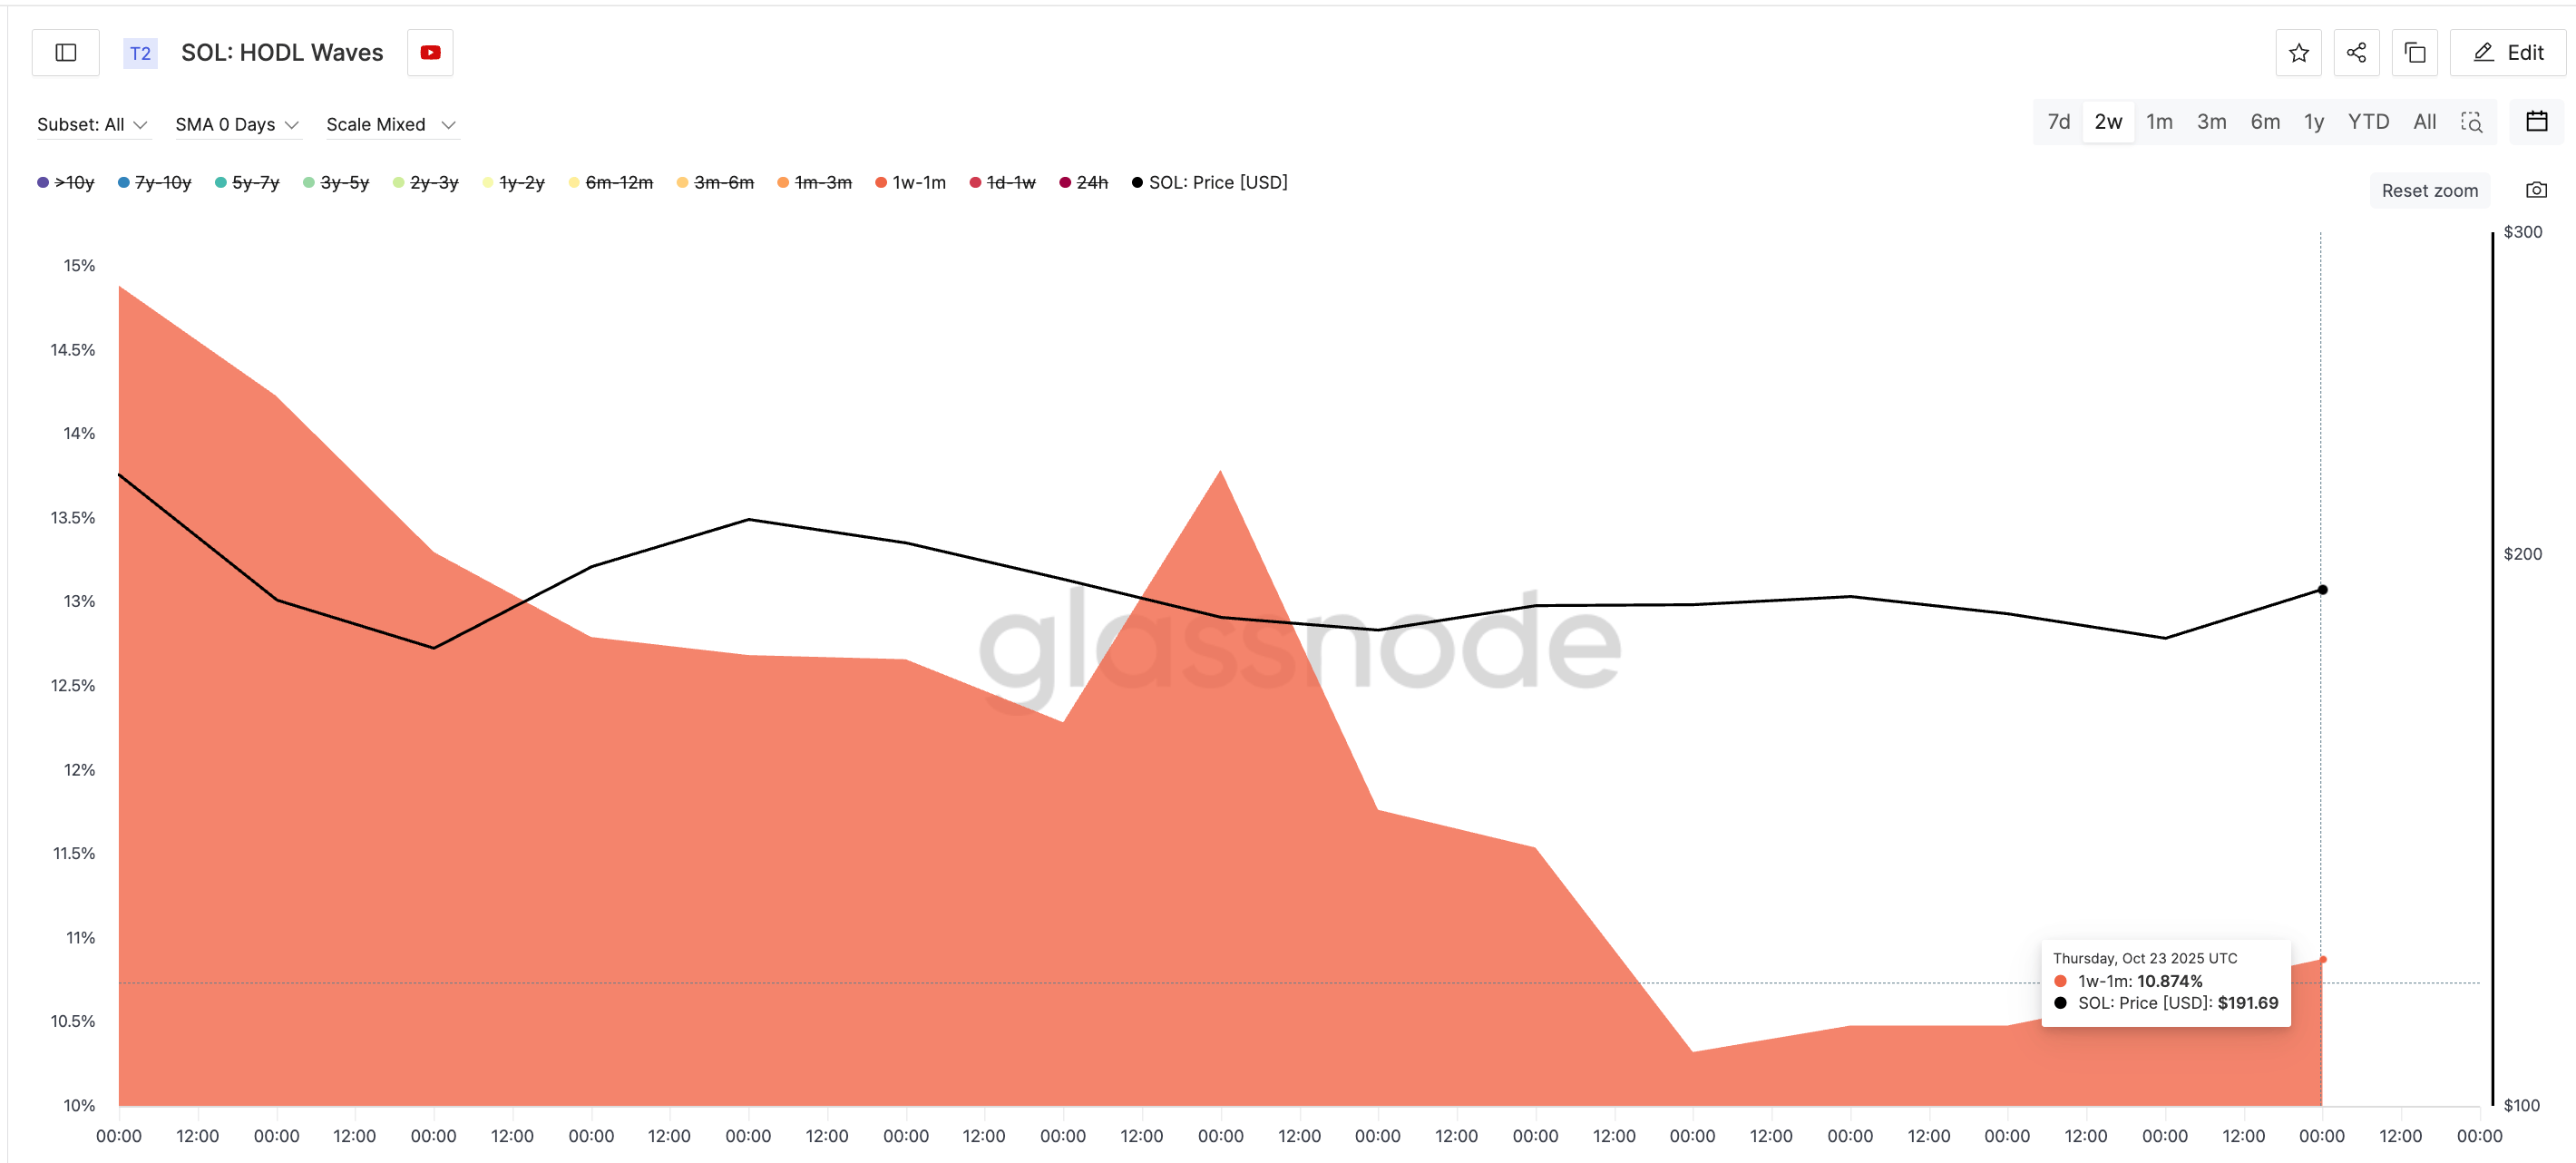
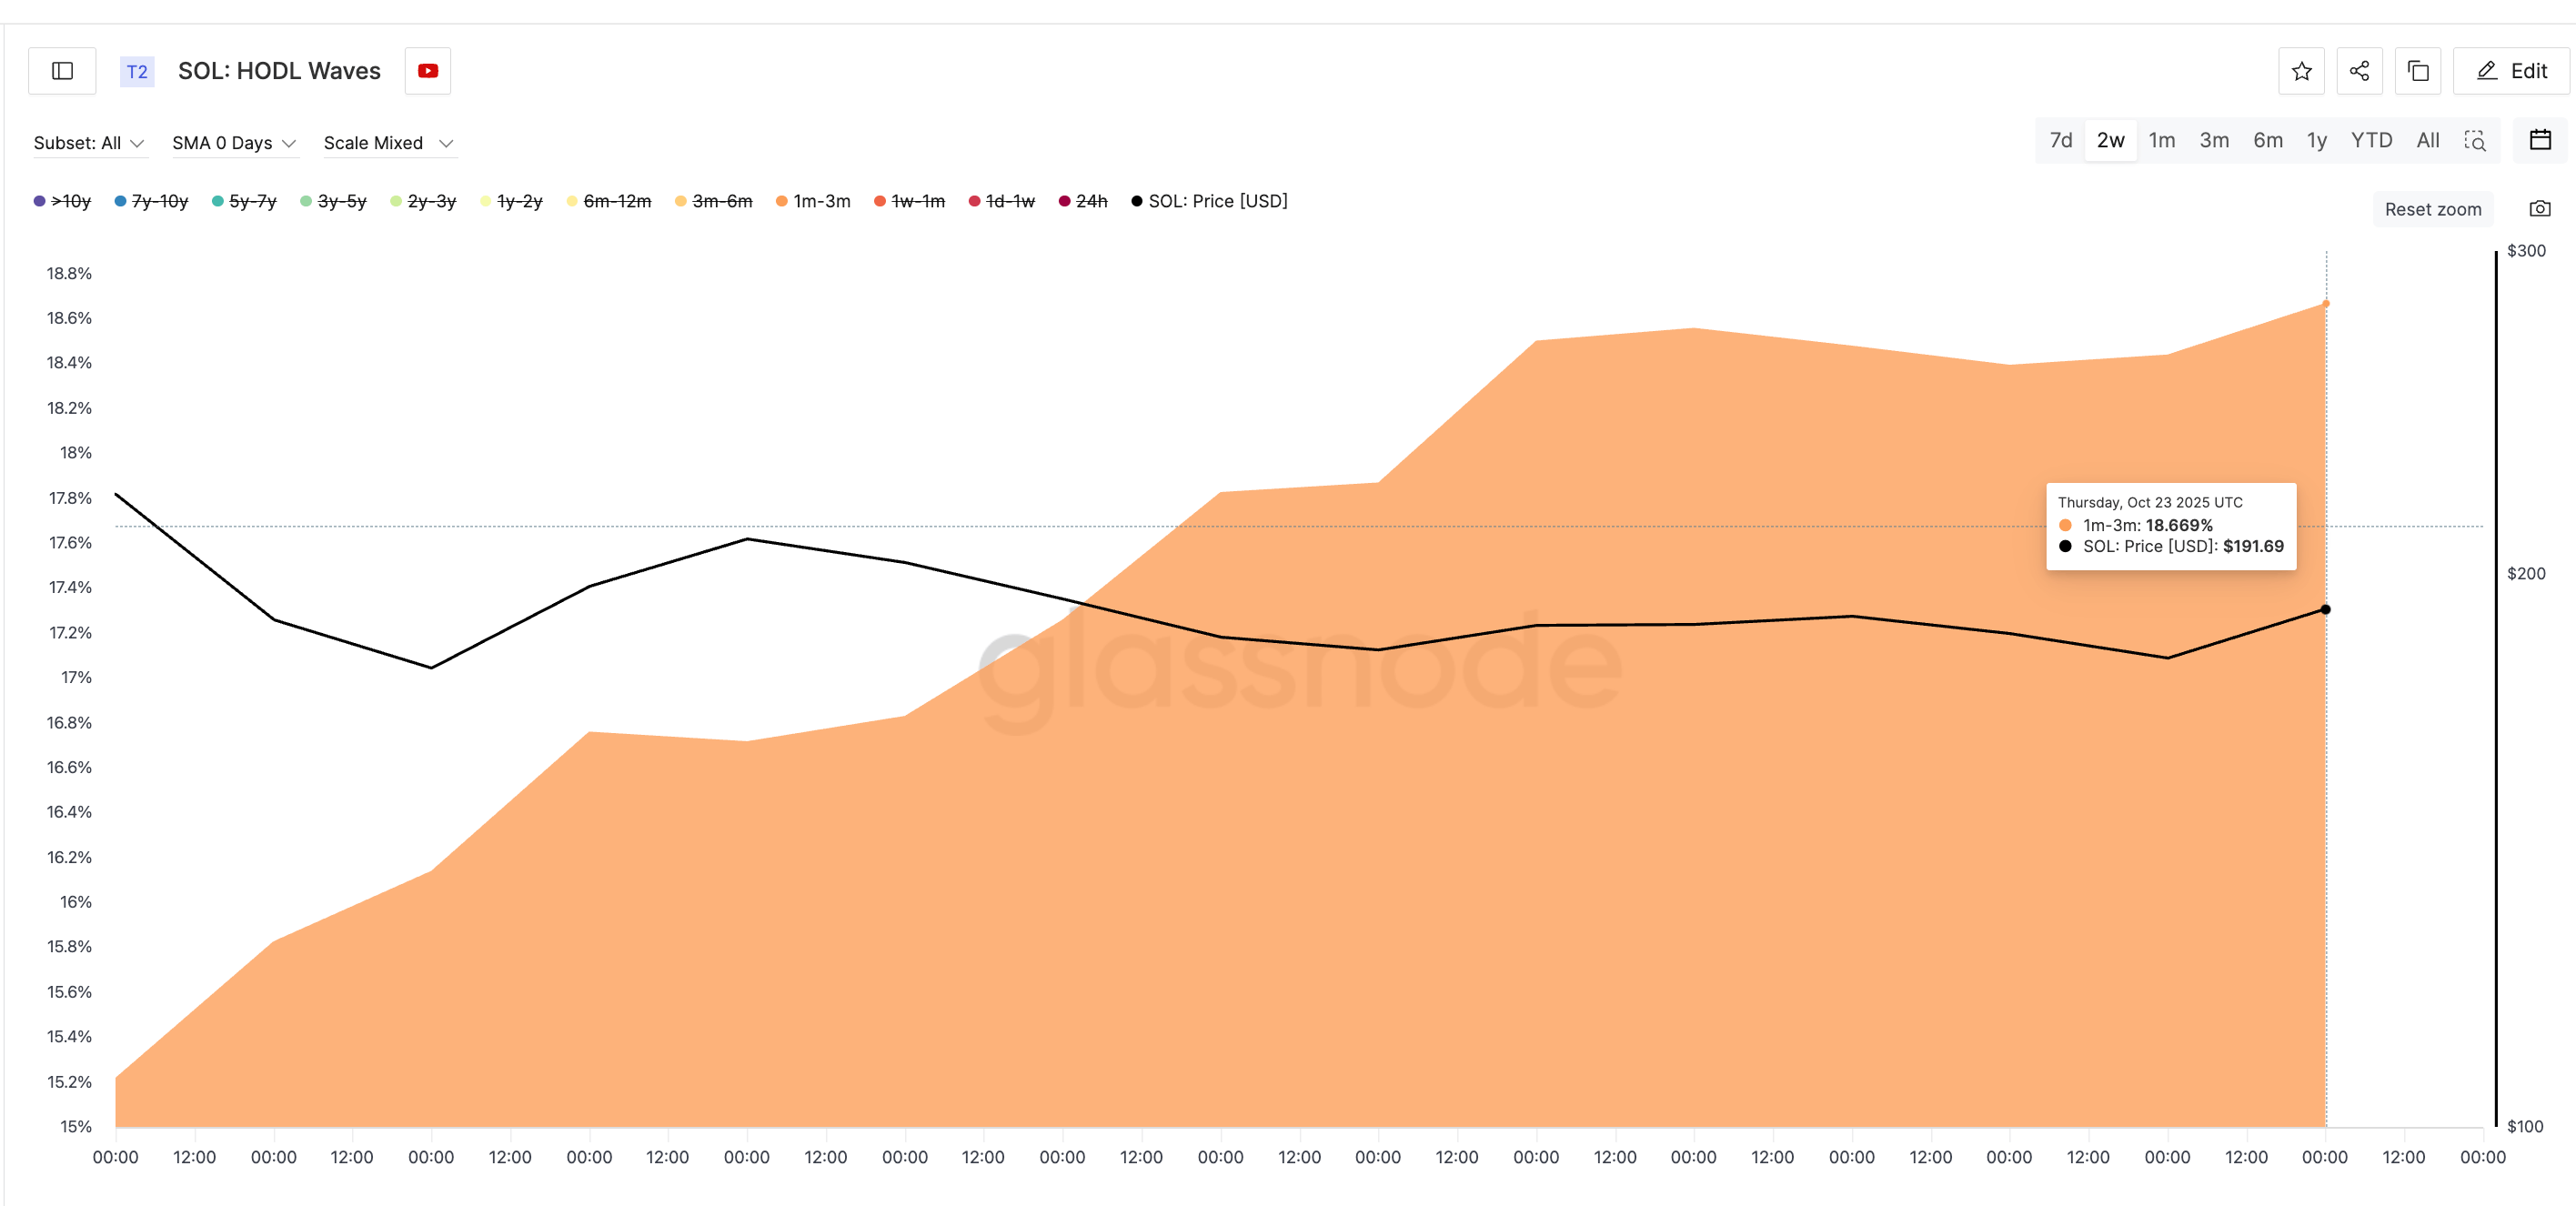
To see what short-term traders are doing, the HODL Waves metric breaks down supply by holding duration.
It shows that 1-week–1-month wallets cut their share from 14.88% on October 9 to 10.87% on October 23, suggesting traders might have been taking profits on small rallies.
Sponsored
Want more token insights like this? Sign up for Editor Harsh Notariya’s Daily Crypto Newsletter here.
Meanwhile, the 1–month–3–month group raised its share from 15.21% to 18.66%, showing that slightly longer-term players are quietly buying dips.
Sponsored
In simple terms, short-term sellers are fading out, mid-term buyers are stepping in, and long-term holders are just waiting. That balance explains why SOL has stayed in a range and not dipped massively.
A decisive change in the range-bound nature of SOL price could happen if any of the mentioned groups make a move. For instance, if the long-term investors start buying (position change in green), the Solana price could get a bullish boost.
However, if they continue to sell, aligning with the short-term holders, a price breakdown theory could surface.
Sponsored
Triangle Pattern Sets the Stage for a Solana Price Breakout
On the daily chart, the Solana price has been trading inside a symmetrical triangle since mid-September, a structure that shows market indecision. Each swing high is lower, and each swing low is higher, forming a tightening range.
The fight could end soon. A breakout above $211 would give buyers the upper hand and mark a move beyond the triangle’s top. A breakdown below $174 would signal that sellers have regained control.
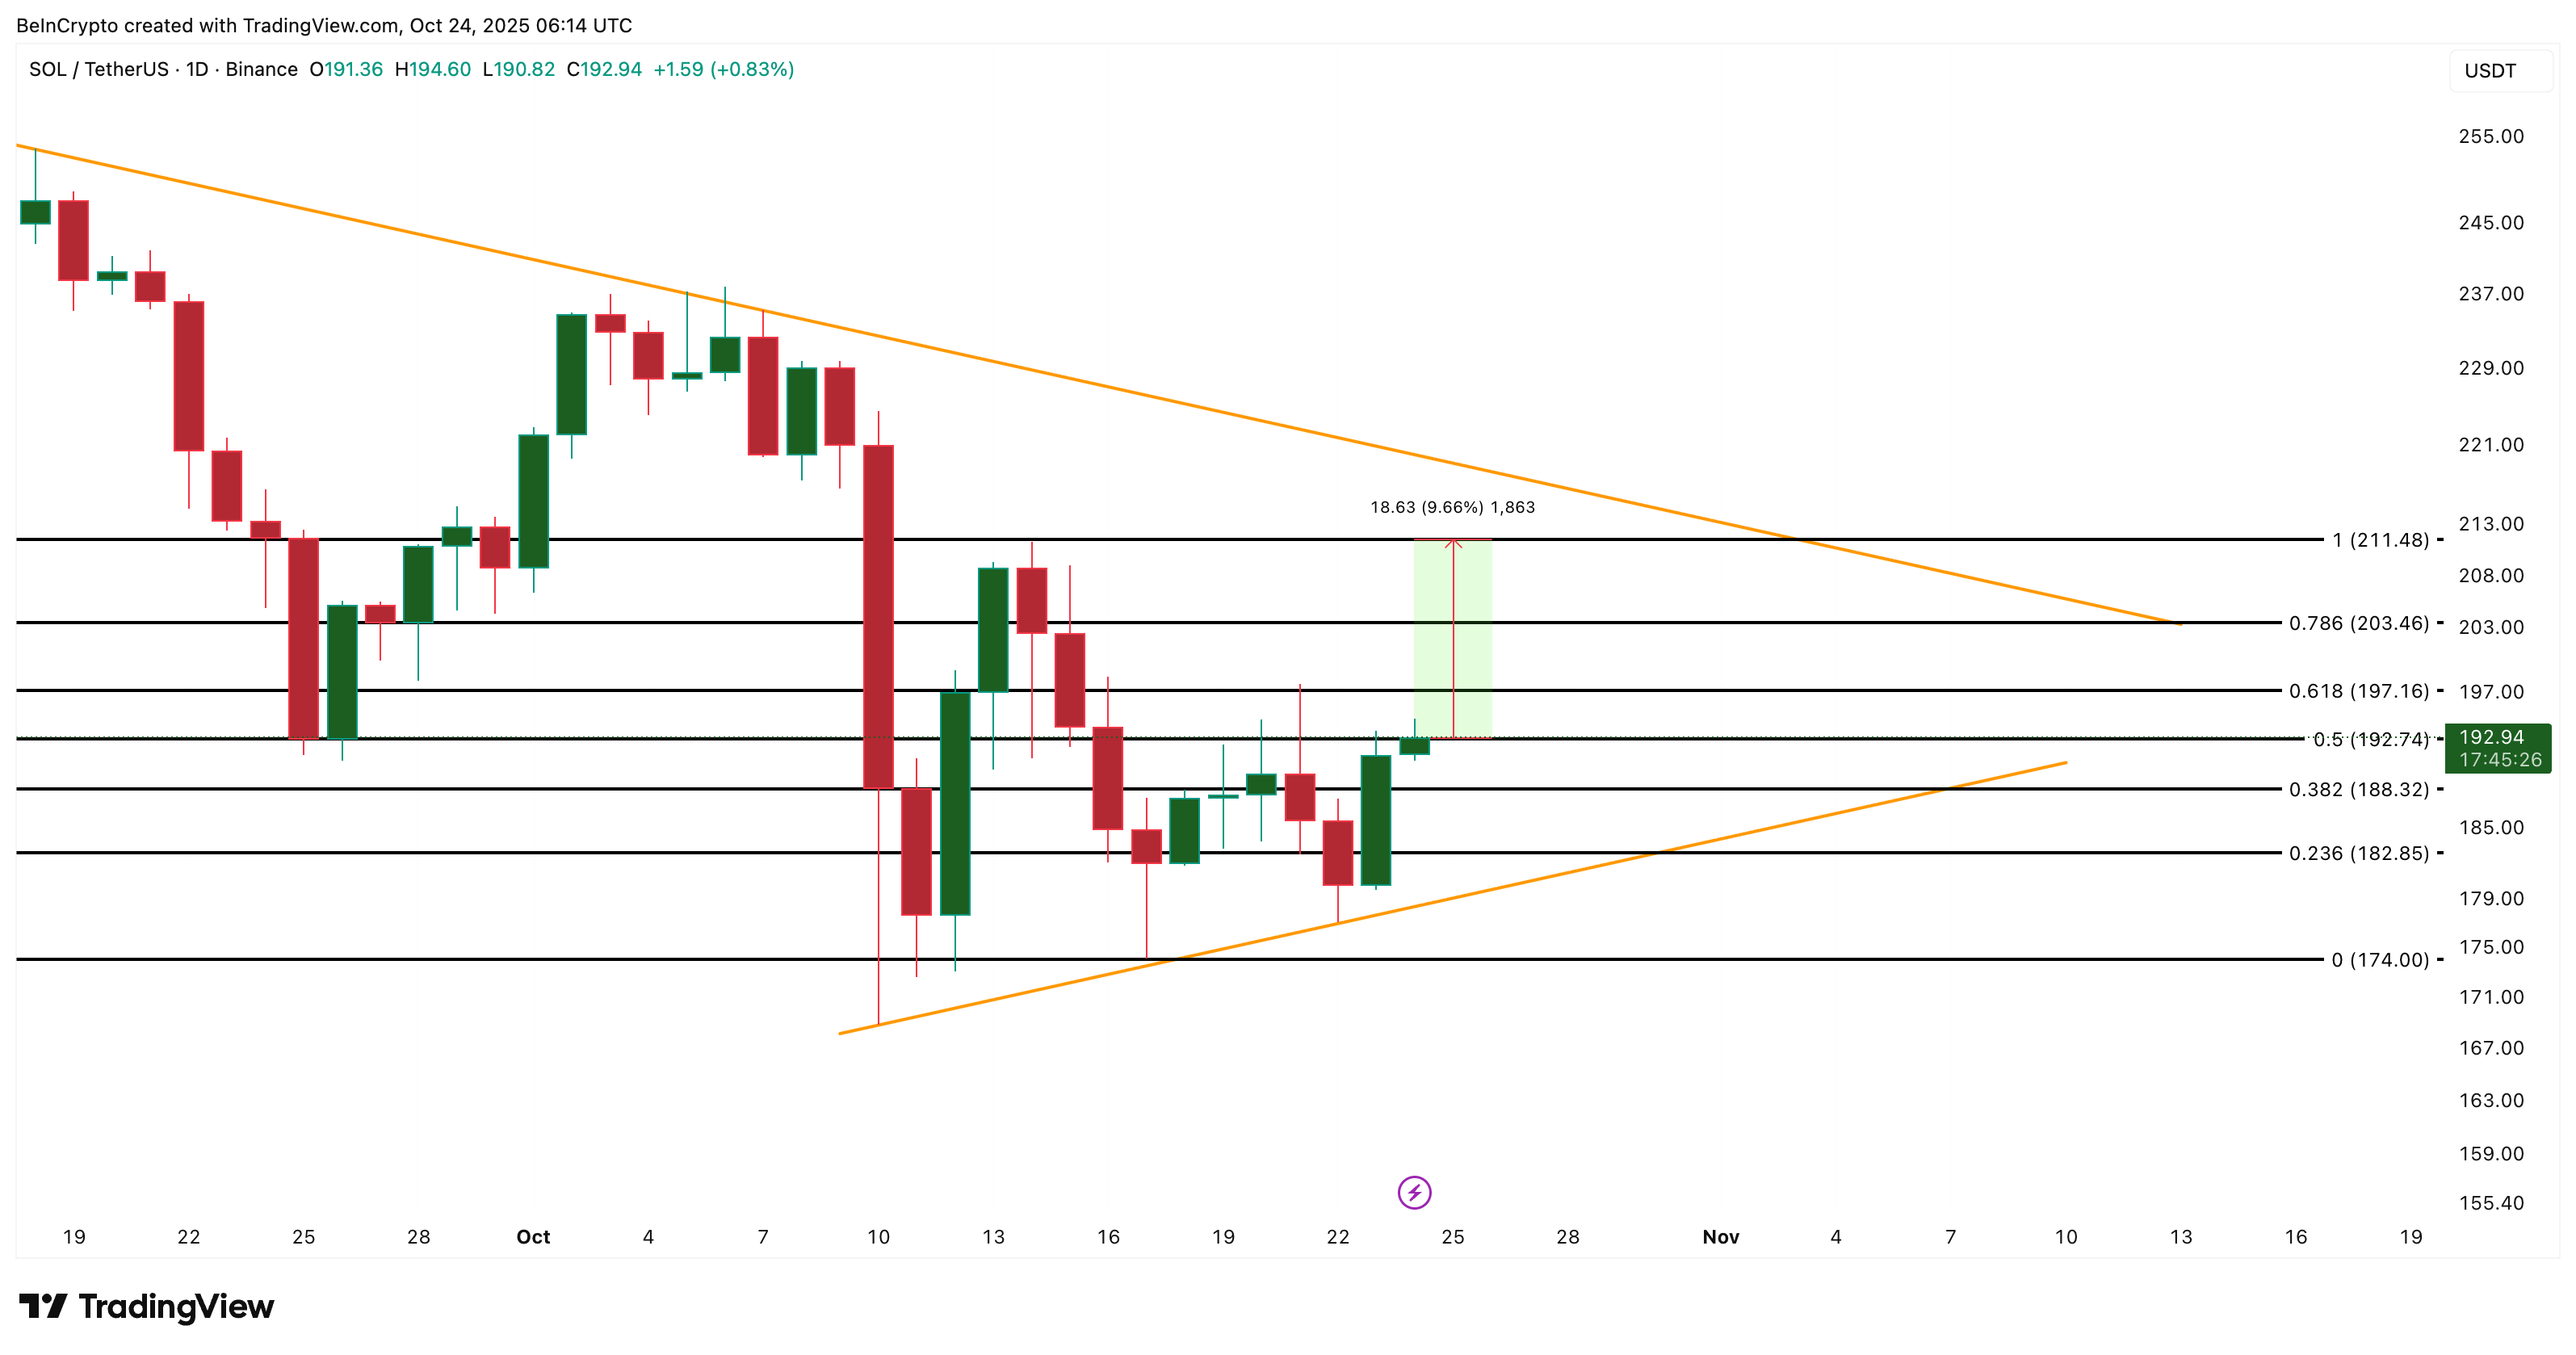
Until then, $197 serves as the first resistance, and $188 remains key support. A close below $188 could open $174, while a rebound above $197 might kick off a run toward $211 (over 9% surge from the current levels) and higher.
Solana’s buyer-seller battle is still balanced, but not for long. The charts and on-chain data agree: the next decisive break is close.

